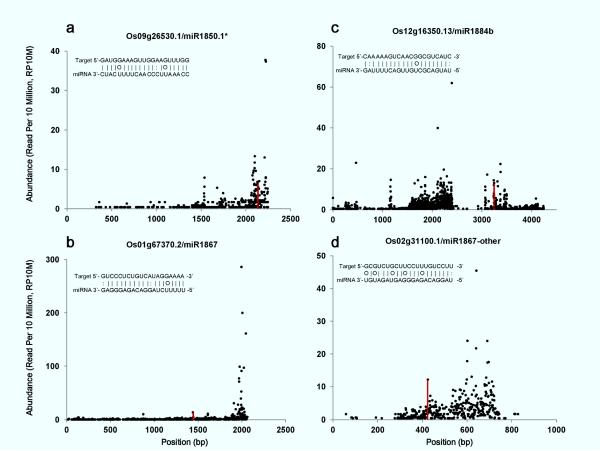
Figure 1.
Target plots of predicted targets for repeat-associated miRNAs. Publically available rice degradome data were pooled together. The abundance of each sequencing “tag” was plotted as a function of its position on miRNA target transcript. Normalized abundance was presented (reads per ten million, RP10M). The “tags” matching ±1 positions of the expected miRNA cleavage site were combined and are shown as red vertical bars.

