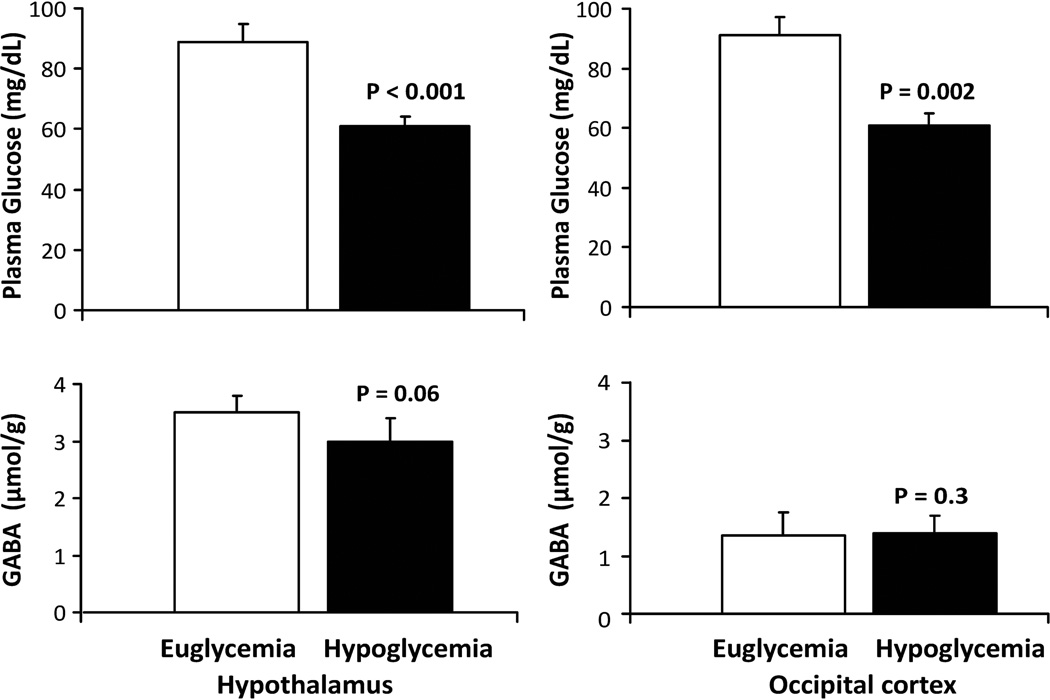
Figure 3.
Mean hypothalamic and occipital cortex GABA concentrations and plasma glucose levels during euglycemia (white bars) and hypoglycemia (black bars). Glucose and GABA levels obtained during the last 10 minute block of euglycemia and during the first 10 minute block after the participant’s glucose fell below 70 mg/dL are shown. Error bars are SD.

