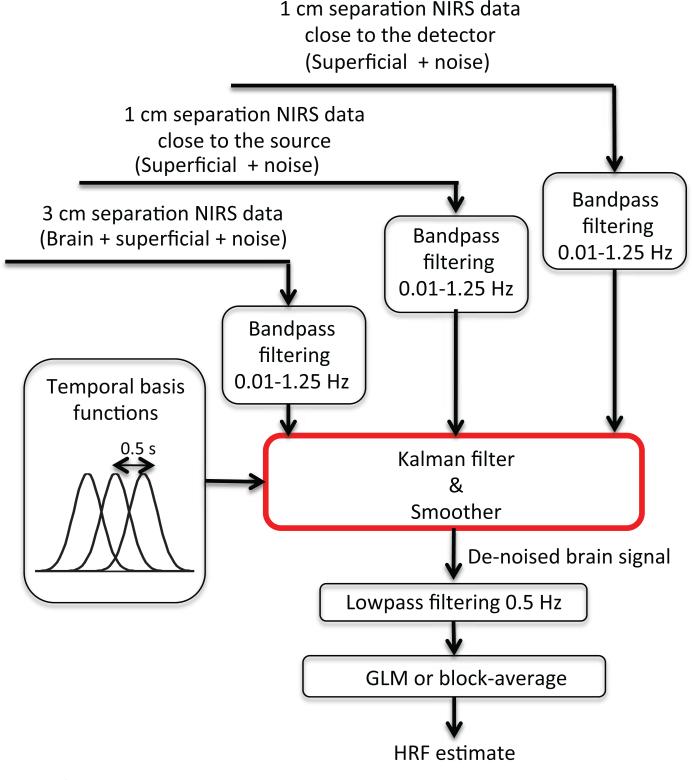
Figure 2.
Overview of the algorithm for data analysis. Both the SS and LS measurements were bandpass filtered at 0.01-1.25 Hz and then used simultaneoulsy as regressors in the Kalman filter. A set of temporal basis functions was used to lower the dimensionality of the problem. The output of the Kalman filter was further low pass filtered at 0.5 Hz to remove any cardiac fluctuations potentially present in the time course and the final estimate of the hemodynamic response was obtained by applying a standard General Linear Model (GLM) procedure.

