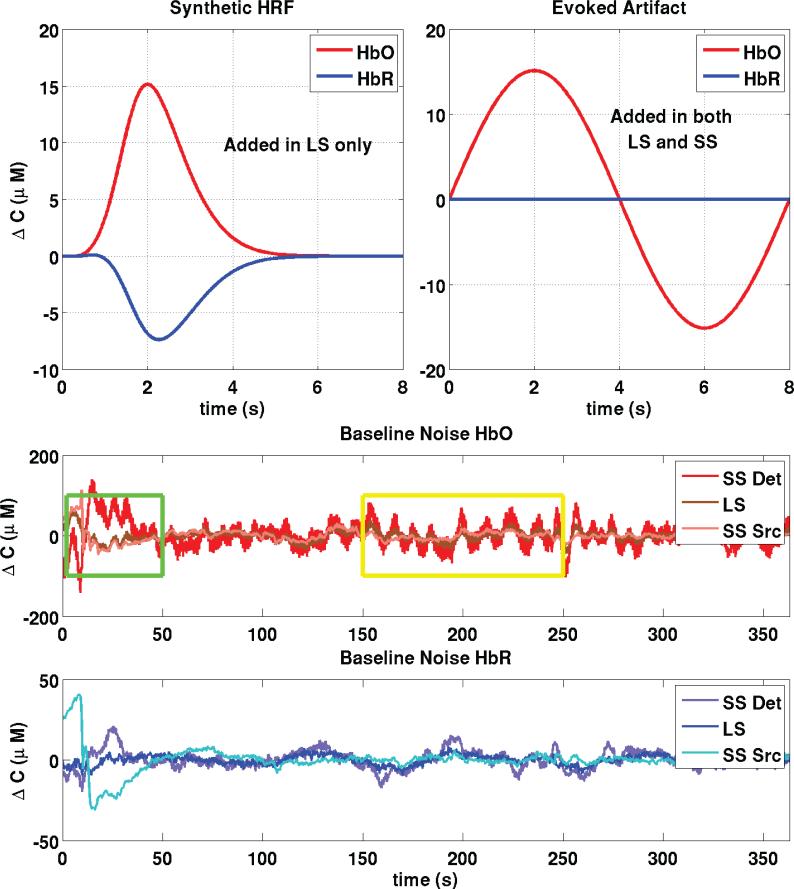
Figure 3.
Construction of synthetic data. Thirty individual evoked responses were added over all 60 LS baseline measurements (5 subjects × 3 runs × 4 LS channels) at random onset times with an inter-stimulus interval taken randomly from a uniform distribution (12-30 sec). We also added an evoked systemic artifact to the HbO signals (LS and SS) that was phase-locked with the stimulus onset. The green box emphasizes a portion of the baseline signal where the Source SS signal resembles the LS signal while the yellow box emphasizes a portion where the Detector SS signal resembles the LS signal.

