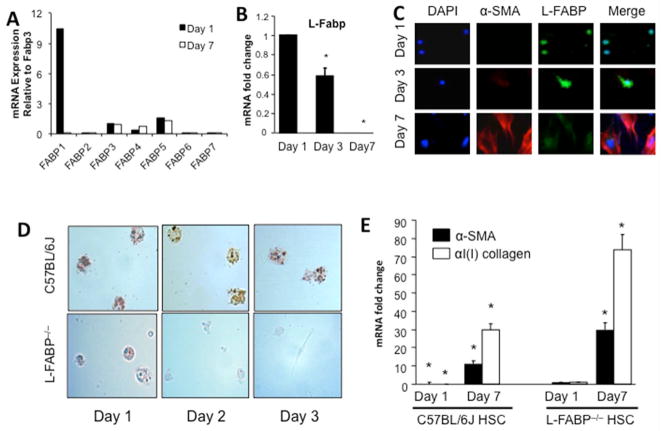
Figure 1. L-Fabp is expressed in quiescent HSCs and decreases upon activation.
(A) Relative expression of Fabp family member mRNAs in freshly isolated (Day 1) and activated (Day 7) C57BL/6J HSCs. Data are generated from pooled RNAs and are expressed relative to Fabp3 expression in Day 1 HSCs. Fabp3 was chosen because its expression does not change upon HSC activation. (B) Relative expression of L-Fabp mRNA in C57BL/6J HSCs after 1, 3 or 7 days of culture. Values are presented as mRNA fold change vs expression in Day 1 cells (mean ± standard deviation (SD), n=3). Asterisk indicates p<0.05 vs. Day 1. (C) Isolated C57BL/6J HSCs were cultured for 1–7 days and subjected to immunohistochemistry with antibodies to α-smooth muscle actin (α-SMA) and L-Fabp to monitor protein expression. Nuclei were visualized with DAPI staining. (D) HSCs were isolated from wild-type C57BL/6J and L-Fabp−/− mice and stained with Oil Red O after 1–3 days of culture to visualize neutral lipid droplets. Representative images from 10 views in three independent experiments are presented. (E) Real-time PCR quantitation of α-SMA and α(I)ICol mRNA in C57BL/6J and L-Fabp−/− HSCs after 1 or 7 days of culture. Values are presented as mRNA fold changes versus the level of expression of α-SMA or α(I)ICol in L-Fabp−/− HSC after one day of culture (mean ± SD, n=3), as levels of these mRNAs in were barely detectable Day 1 HSC from C57BL/6J mice. *p<0.05 vs. Day 1 L-Fabp−/− HSCs.

