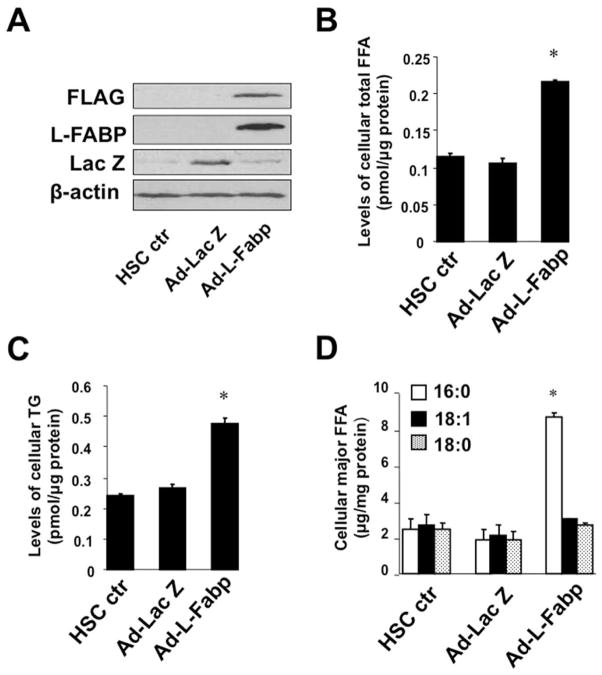
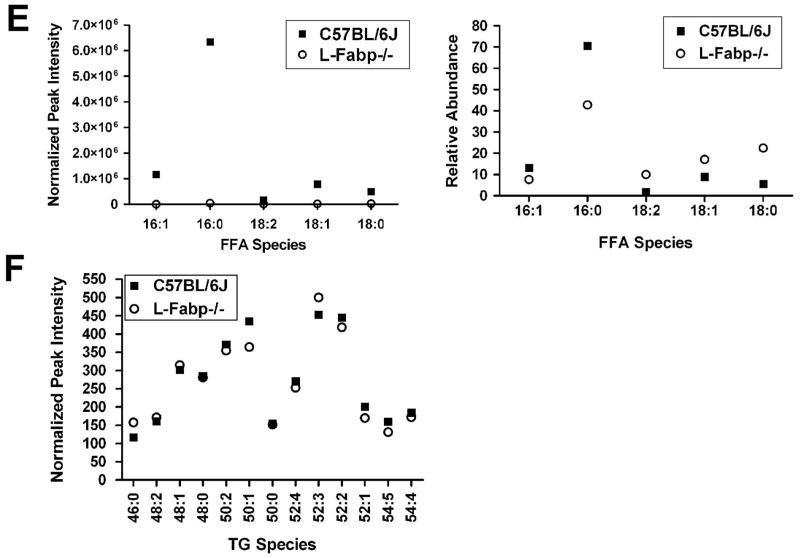
Figure 2. Ad-L-Fabp transduction augments TG and FA content in HSCs in vitro.
(Panel A–D) Passaged HSCs were transduced with no adenovirus (HSC ctr), adenovirus containing L-Fabp cDNA tagged with a FLAG peptide (Ad-L-Fabp), or adenovirus with LacZ (Ad-LacZ) as a mock control. After two days of culture, total RNA and whole cell extracts were prepared. For panels B–D, asterisks indicate p<0.05 vs. control HSC. (A). Western blotting analyses demonstrate expression of FLAG epitope-tagged L-Fabp and Lac Z in Ad-L-Fabp and Ad-Lac Z transduced cells, respectively. β-actin was used as an internal control for equal loading. (B). Biochemical measurement of cellular free fatty acid (FFA) content. Values are expressed as pmol/μg protein and presented as mean ± SD (n=3). (C). Biochemical quantitation of cellular triglyceride (TG) content. Values are expressed as pmol/μg protein (mean ± SD, n=3). (D). Identification of FFA by electrospray ionization mass spectrometry (ESI-MS). Only the major classes of FA are shown and values are expressed as μg/mg protein (means ± SD.) (n=3). (Panel E–F) Lipidomics analysis of FFA and TG species present in freshly isolated (Day 0) HSCs from C57BL/6J and L-Fabp−/− mice. Data represents average abundance of lipids in 2 pools of HSC per genotype, with each pool containing HSCs isolated from 5–8 mice. (E). Major FFA species in C57BL/6J and L-Fabp−/− HSCs, presented either as peak intensity normalized to total cellular protein (left panel) or relative abundance of each FFA species (right panel). (F). Average abundance of individual TG species presented as peak intensity normalized to cellular protein. TG species are identified as total number of carbons: total number of double bonds in the fatty acid chains.


