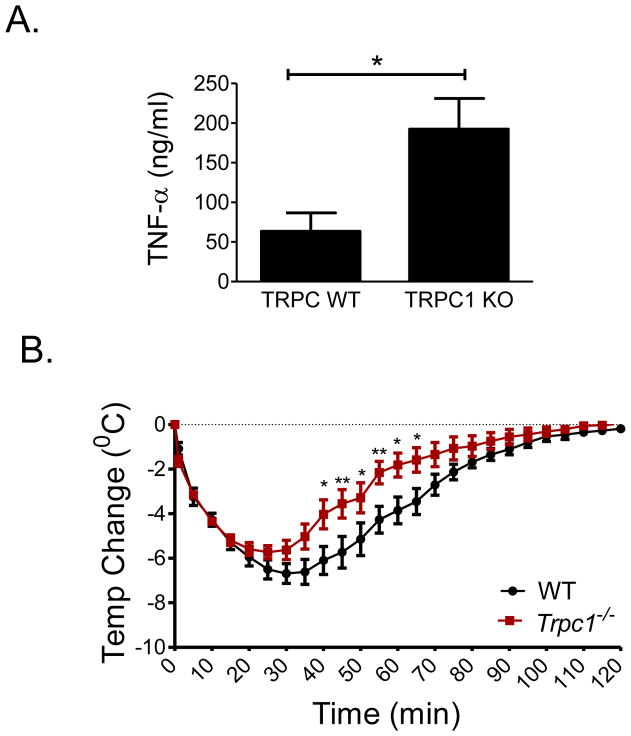
FIGURE 2. TNF-α release and anaphylaxis in WT and Trpc1−/− mice.
A: Mice were sensitized by injecting anti-DNP IgE (i.v.). The next day, anaphylaxis was induced by i.v. injection of DNP-HSA as described in Figure 1. After 2 h, blood was collected, and serum TNF-α levels were measured by ELISA. Data are presented as the mean ± SEM. (N=7 for WT and N=6 for Trpc1−/−; *p<0.05, two tailed Student’s t-test). B: Mice were sensitized using 3 μg anti-DNP IgE mAb. After 24 h the mice were injected with 10 μg anti-TNF-α antibody. After 1 h, mice were injected with antigen (DNP-HSA; 200 μg), and the change in core body temperature was monitored every 5 min for 2 h. The data are represented as the mean ± SEM. N=7 (*p<0.05, **p<0.01; two way ANOVA).

