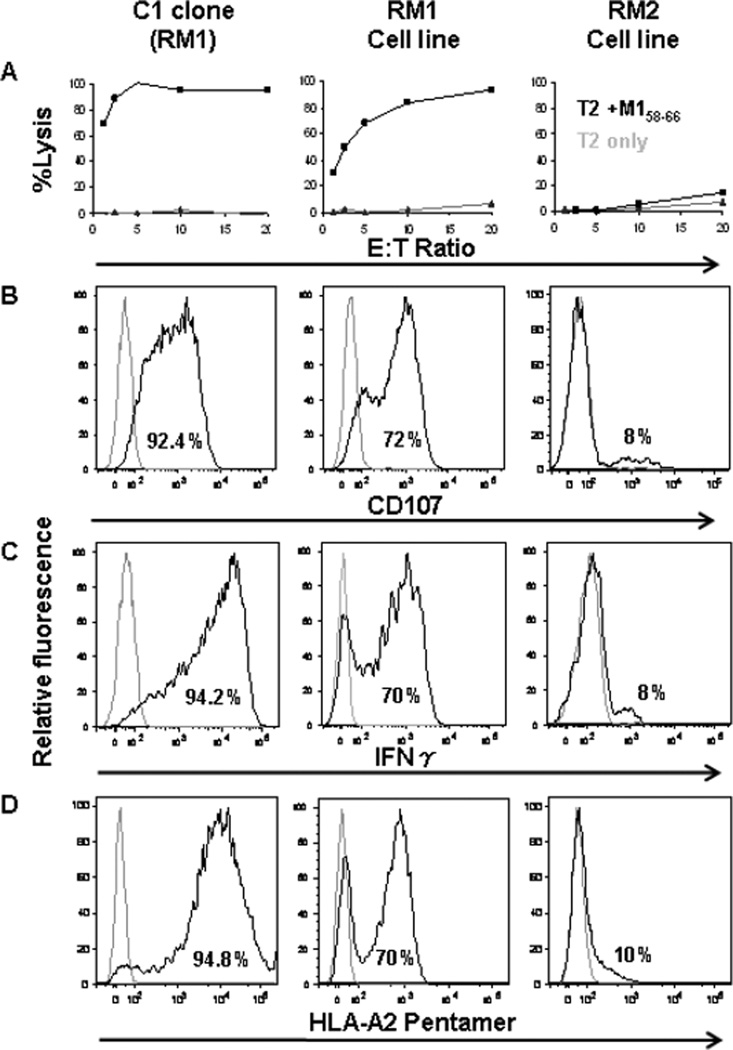
Figure 1. Phenotypic and functional analysis of a clone and two cell lines.
The first column from the left shows the analysis of C1 clone, and the 2nd and the 3dr columns show the analysis of the two cell lines (RM1 and RM2 respectively). A. Lysis of T2 target cells; X-axis shows E:T ratio, and Y-axis shows the % of lysis. Black line shows the % of lysis at different E:T ratio, and the gray line shows the background lysis. B. Relative fluorescence of CD107 expression presented as histograms. C. Relative fluorescence of IFNγ intercellular staining presented as histogram, D. Relative fluorescence of HLA-A2-M158–66- Pentamer staining is presented as histogram. In all histograms, the percentage of relative fluorescence for each staining is shown inside the histogram, and the gray histogram is the control.

