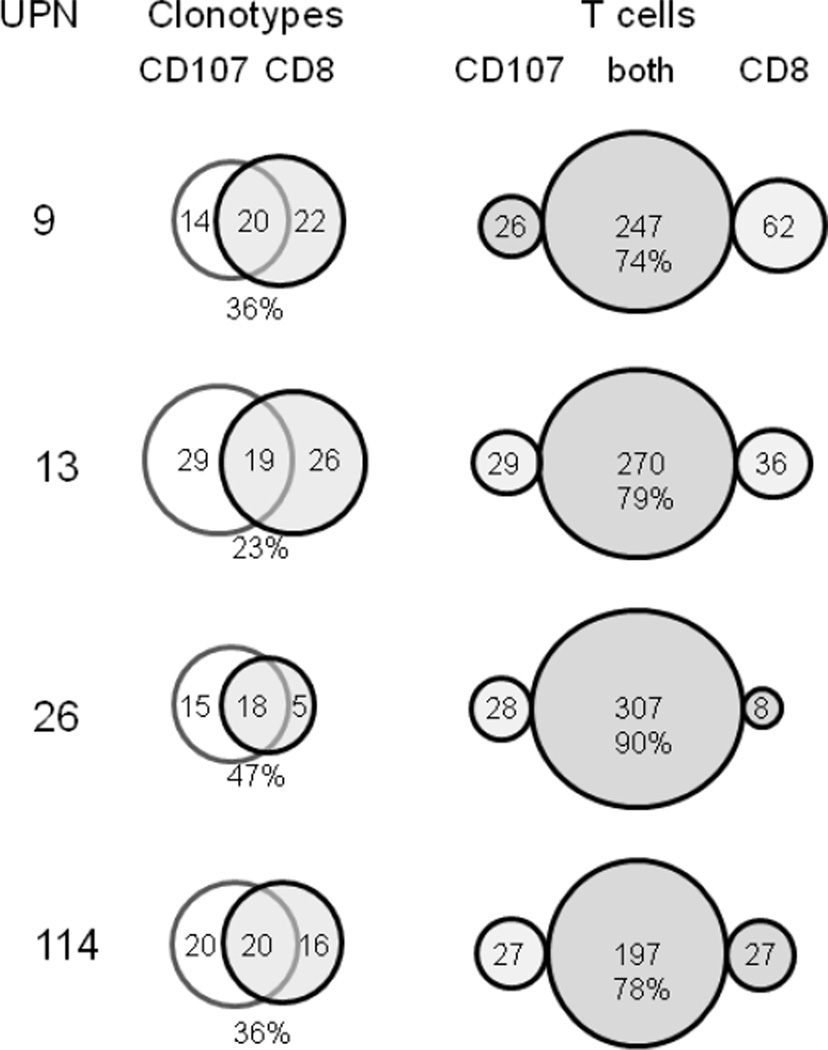
Figure 4. Clonotype and T cell overlap between CD8 CD107 repertoires and CD8 repertoires in recall analyses.
The UPN are identified at the left. The Venn diagrams show the clonotype overlap. The percent of overlapping clonotypes is given below the overlap zone. On the right the distribution of T cells as measured by the number of sequences is shown in the form of bubble graphs. The percent of T cells observed in both repertoires is shown below the actual measured number.

