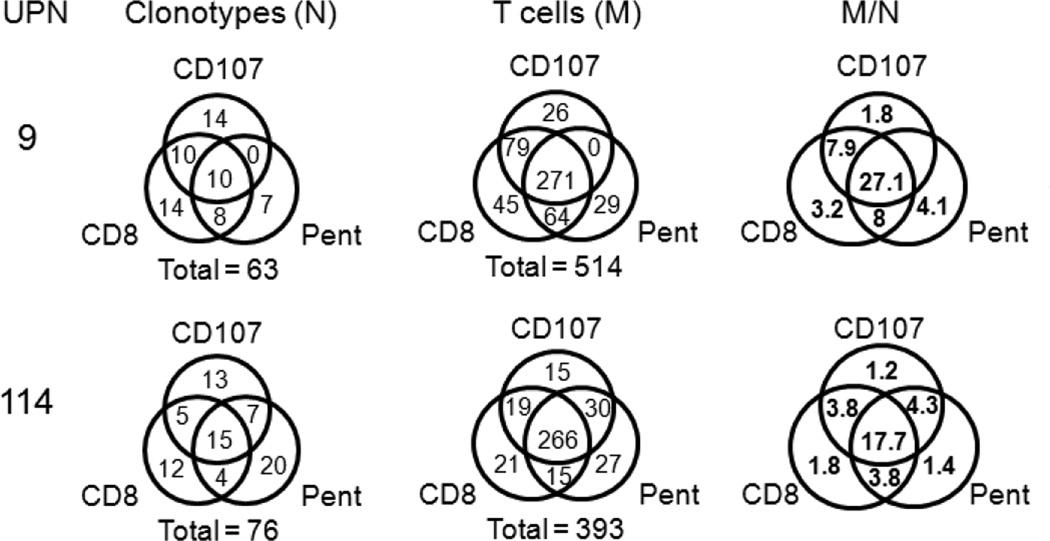
Figure 6. Clonotype and T cell overlap between CD107+CD8+-selected, HLA-A2 M158–66 pentamer+CD8+-selected, and CD8+-selected repertoires from recall analyses.
Venn diagrams are used to show the data for each selection-based repertoire subset. The selection methods are identified next to each circle. All the selection methods included CD8+ but this is dropped in the labeling of the CD107-selected and M158–66 HLA-A2 pentamer (Pent)-selected subsets. The UPN is identified on the left of each series. For the diagrams showing the clonotype in each subset (N) and those for the actual T cell observations (M) the total number of clonotypes or measurements is shown below each diagram. The leftmost set of diagrams shows the observations per clonotype for each selection-based subset.

