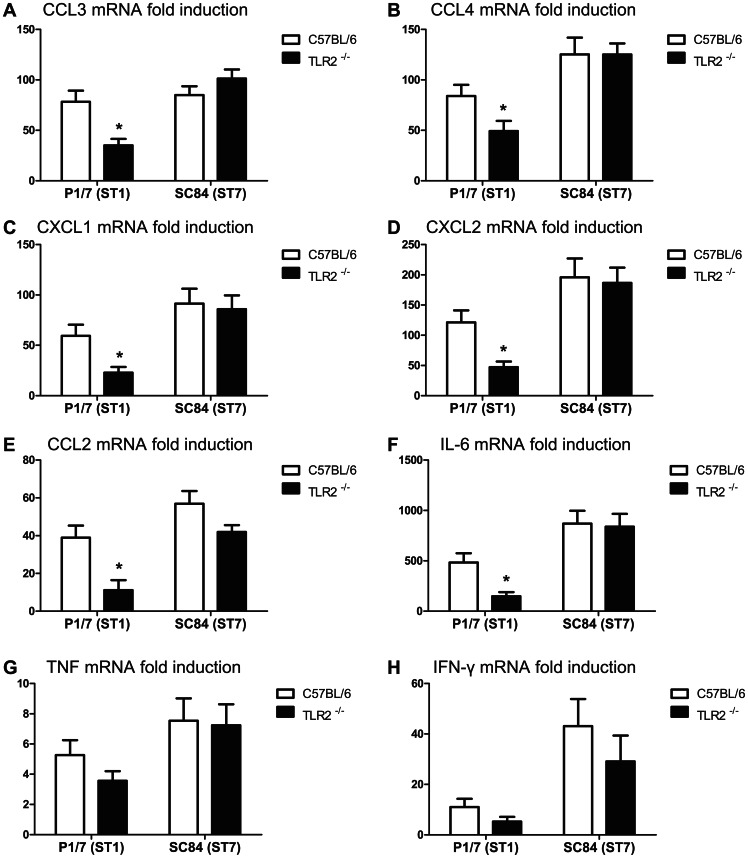
Figure 3. Proinflammatory cytokines and chemokines gene expression in TLR2−/− or wild-type mice infected with ST1 or ST7 strain.
Proinflammatory cytokine and chemokine gene expression in TLR2−/− mice infected with S. suis highly virulent strain ST1 is lower than wild-type counterparts, whereas no major differences are observed between epidemic strain ST7-infected groups. Quantitative PCR analysis of cytokine and chemokine gene expression in C57BL/6 and TLR2−/− mice infected with 1×10⁷ CFU of either S. suis strain P1/7 (ST1) or SC84 (ST7). Total RNA was isolated from spleen samples at 6 h post-infection. Tested cytokines and chemokines are indicated at the top of each panel. Data represent mean mRNA relative fold induction values ± SEM. * P<0.05, indicates TLR2−/− group significantly different from corresponding C57BL/6 mice as determined by t-test.

