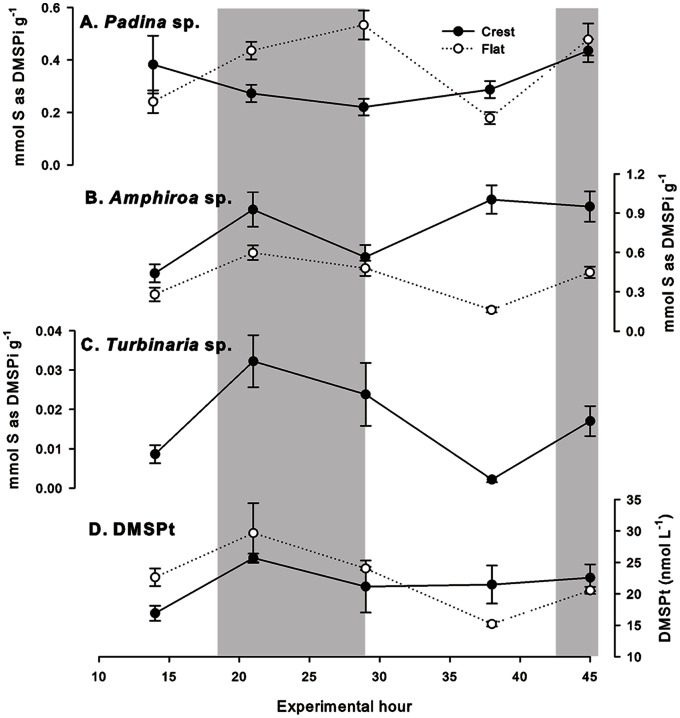
Figure 2. Diel pattern of DMS/P measurements on Suleman Reef, Egypt.
Intracellular DMSP (mg S g−1 algae as intracellular DMSP, DMSPi) of A: Padina sp., B: Amphiroa sp. and C: Turbinaria sp. and, in the water column, D: total DMS+DMSP (DMSPt, nmol L−1) on the reef crest (black circles) and reef flat (open circles) over a 45-hour period on Suleman Reef, Egypt. Grey shading indicates night-time (sunset – sunrise). Data presented as mean±SE. Note the different y-axes on all graphs.

