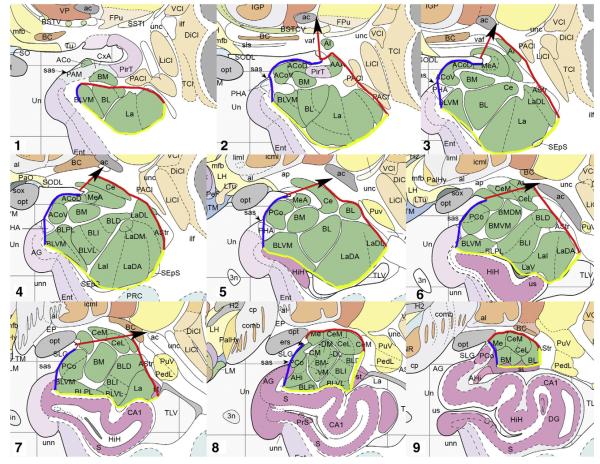
Fig. 2.
Illustration of idealized boundaries manually drawn on Mai atlas figures (Mai et al., 1997), from most rostral (1) to most caudal (9). Medial boundaries are in blue; dorsal and dorsolateral boundaries are in red; ventral and ventro-lateral boundaries are in yellow. Red arrows are shown to indicate direction of dorsal boundary toward anterior commissure; arrows are not part of the tracing protocol. See Box 1 for abbreviations. (For interpretation of the references to color in this figure legend, the reader is referred to the web version of this article.)
Images are reproduced with permission from Elsevier Inc.

