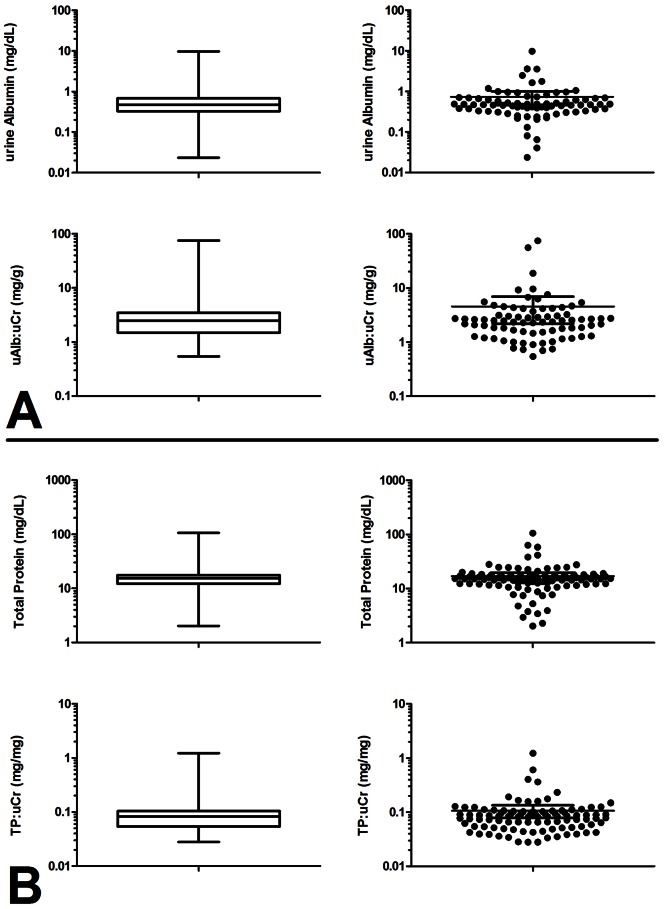
Figure 1. Distribution of urine albumin and total protein levels in healthy donors.
A. Box-whisker and scatter plots of urine albumin distributions in urines. (Top panels: urine albumin concentration in mg/dL; Bottom panels: ratio of urine albumin to urine creatinine in mg/g). B. Box-whisker and scatter plots of urine total protein distributions in urine. (Top panels: urine total protein concentrations in mg/dL; Bottom panels: ratio of urine total protein to urine creatinine in mg/mg). Urine albumin, creatinine, and total protein were measured in urines obtained from 103 healthy donor by bead-based immunoassay, ELISA, and Bradford method, respectively. Boxes represent 25–75th percentiles, whiskers represent range.

