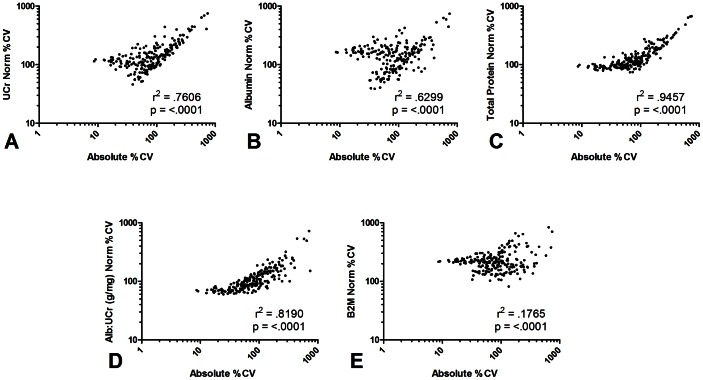
Figure 2. Effect of several normalization methods on the population variability of urine proteins.
Urines obtained from 103 healthy donors were evaluated for levels of 211 proteins using multiplexed bead-based immunoassays. Coefficients of variation (CV) were determined for each of the 211 urine proteins based on absolute and normalized values. Correlation between the two sets of values was evaluated using Pearson's test of correlation. Normalized values were calculated by dividing absolute biomarker concentration by the level of several urine parameters: A. urine creatinine (UCr); B. urine albumin; C. urine total protein; D. ratio of urine albumin to urine creatinin (ACR); E. β-2-microglobulin.

