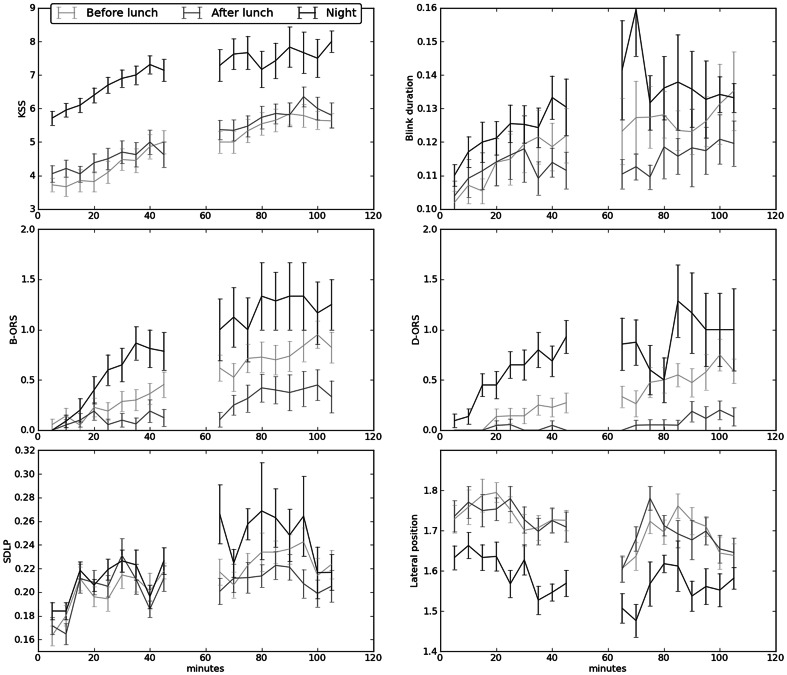
Figure 3. Drivers’ sleepiness and driving performance in relation to design parameters.
Footnote: Driving session (before lunch, after lunch and night) and time on task (Minute 0–45 and 60–105). Error bars represent SE mean. SDLP = standard deviation of lateral position. KSS = Karolinska Sleepiness Scale.

