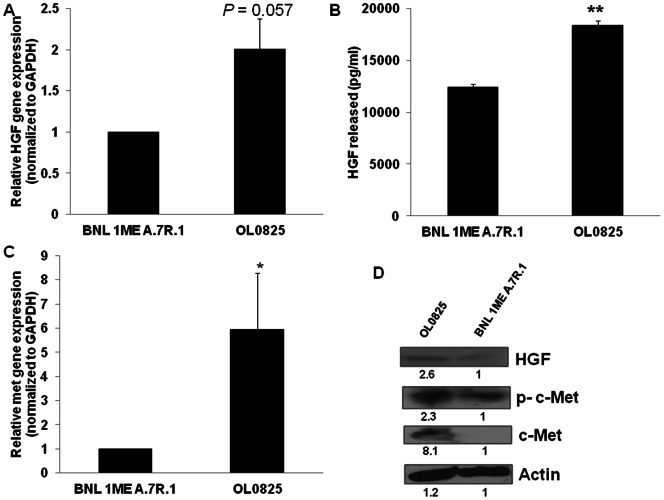
Figure 4. HGF and c-Met overexpression in HCC CTCs.
Analysis of gene expression of HGF and c-Met was performed by qPCR. c-Met protein expression analysis was performed by Western blotting. Analysis of HGF protein expression and secretion were performed by Western blotting and ELISA respectively. Gene expression of HGF (A) and c-Met (C) is increased in OL0825 in comparison to BNL 1ME A.7R.1. B. HGF protein secretion is significantly higher in OL0825 cells than in BNL 1ME A.7R.1 cells. D. OL0825 has increased protein expression of HGF, c-Met and phosphorylated c-Met (p-c-Met) in comparison to BNL 1ME A.7R.1. Relative densitometry is indicated below the bands. Results presented as mean ± SEM; P<0.05; P<0.01; N = 3 (for qPCR); N = 6 (for HGF ELISA).

