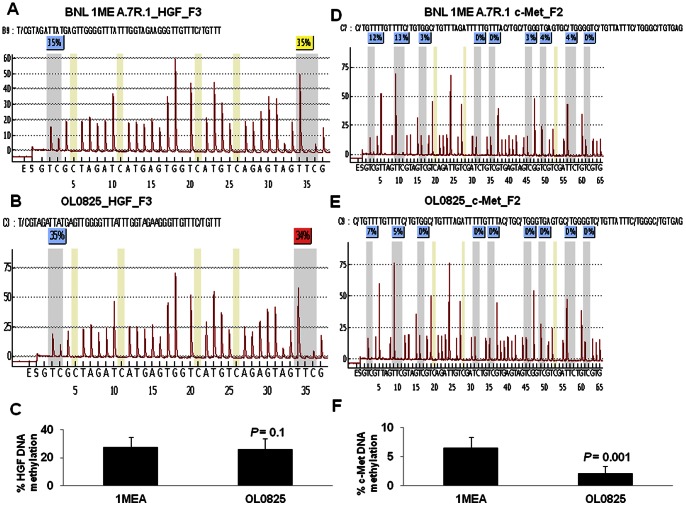
Figure 6. DNA methylation analysis of HGF and c-Met promoters.
A. Analysis of bisulfite DNA from BNL 1ME A.7R.1 cells indicates that HGF has 35% of CpGs methylated at two sites. B. Analysis of bisulfite DNA from OL0825 CTC line shows that the HGF has methylation percentages of 35% and 34% detected at the first and second sites respectively. C. Statistical analysis of the percentage of CpGs methylated in the HGF amplicon (including data from a third CpG site analyzed in Figure S6) shows that there is a small difference between the methylation of BNL 1ME A.7R.1 and OL0825 cells. D. Methylation analysis of c-Met from BNL 1ME A.7R.1 cells indicates the presence of methylation in 6 CpGs including the first 2 CpGs (which are close to 2 putative transcriptional start sites). The percentages of methylation at these first 2 sites are 12% and 13% respectively. E. Methylation analysis of c-Met in OL0825 cells indicates that c-Met has lower methylation than that of BNL 1ME A.7R.1 cells, with the first 2 CpGs being methylated at only 7% and 5% respectively. F. Statistical analysis of the differences between methylation levels in BNL 1ME A.7R.1 and OL0825 cells shows that the data are highly significant. Results presented as mean ± SEM; N = 3 for HGF and N = 6 for c-Met.

