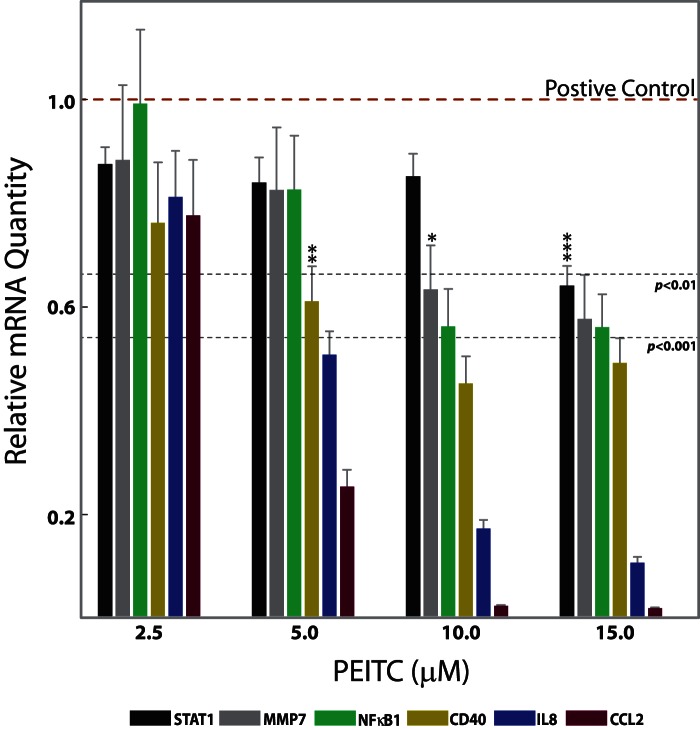
Figure 2. PEITC concentration-dependent mRNA expression of genes of interest (GoI) in SW480 cells at 5 h of PEITC exposure.
Six genes are shown for which PEITC-associated changes in H3 modifications were also observed. GoIs for which PEITC-exposure-associated H3 changes were not observed are shown in Table 3, but not in the current figure. The effects of PEITC treatments were measured by the relative mRNA quantity expressed by GoI in the treated cells. The mRNA quantity was measured using real-time RT-PCR, with GAPDH as an internal control. Lower values represent greater inhibitory effects. Values are mean ± SEM (n = 6). *p<0.05, **p<0.01, ***p<0.001. When all values below the dotted line correspond to the same category of p value, individual stars are omitted to avoid overcrowding of the figure. Statistical significances were measured relative to the positive control, which are cells treated with LPS and no PEITC, showing the highest gene induction levels.

