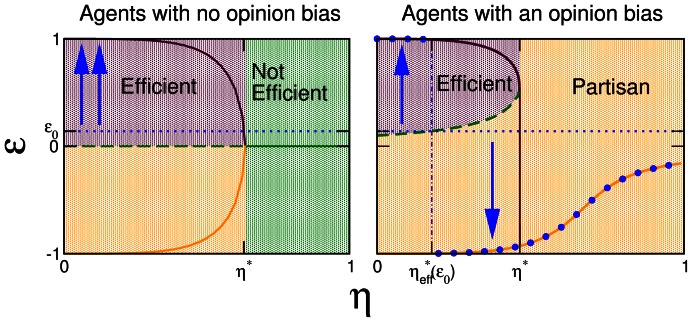
Figure 1. Mean-field solution for a mixed population of agents.
For a fixed fraction  of non-naive agents we plot the steady-state efficiency
  versus the noise amplitude
  . We consider two scenarios: (a) agents with no opinion bias and (b) agents with an opinion bias (see text). Continuous lines show stable solutions, and discontinuous lines show unstable solutions. The maroon regions show the set of initial conditions
  for which
  The orange region covers
  for which
  The green region covers initial conditions
  for which
  . In (b), blue dots show
  for the initial condition indicated by the dotted blue line. Blue arrows indicate the steady-state solution that corresponds to the initial condition represented by the blue dotted line.

