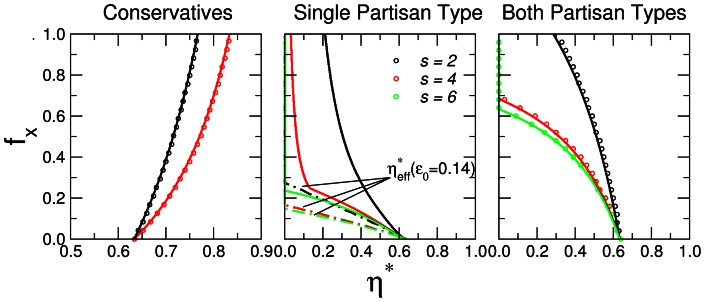
Figure 2. Transition line for the mean-field solution for a mixed population of agents with.

 We plot the noise amplitude
  at which the positive efficiency solution ceases to be stable (see Fig. 1) for a fraction
  of non-naive agents and for different bias strengths
  (see text for the conservative case and
  ). Solid lines show the numerical solution for the steady state condition and dots show the theoretical values from Eqs. (12) (conservatives) and (14) (both types of partisans). For the symmetric cases, those with conservatives and both types of partisans, the line separates the efficient regime for low values of noise amplitude from the non-efficient regime. In the case in which there are only negative partisans, the line separates the efficient regime from the partisan regime in which the system is drawn into a consensus on the opinion held by the initial minority opinion. Note how in the symmetric case
  is independent of
  , the efficiency of the system at time zero. However, in the non-symmetric case of only negative partisans, the transition line depends on the initial efficiency
  . As a guide we show transition lines for
  (solid lines) and
  (dotted lines).

