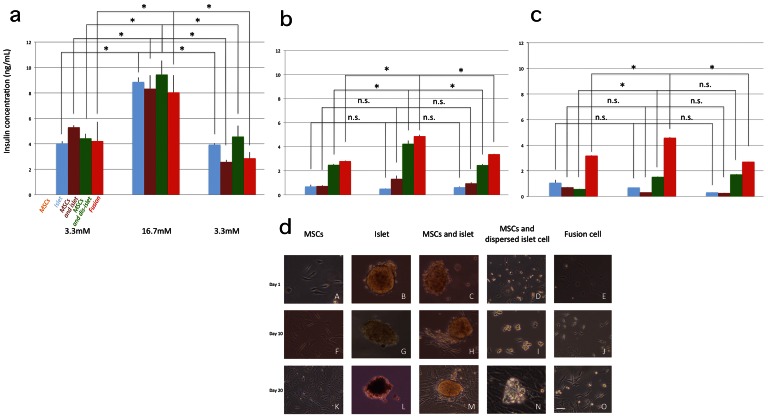
Figure 5. In vitro insulin secretion and microscopic morphology of the tested cells.
a–c: insulin secretion after 1, 10, and 20 day cultures, respectively. (mean±SEM: n = 3, *:p<0.05). d: microscopic morphology, scale bar: 20 µm A–E: after 1 day culture. F–J: after 10 days of culture. K–O: after 20 days of culture.

