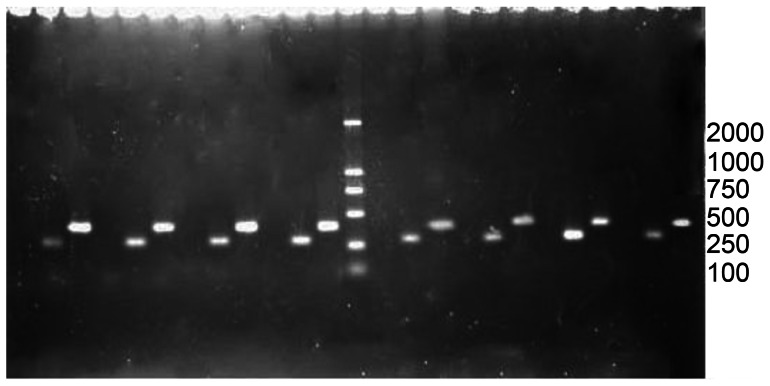
Figure 9. IL-1ra mRNA expression in the grafts.
The level of IL-1ra mRNA gradually decreased with time. The marked 500 bp position corresponds to human 18s rDNA (internal control), and 280 bp corresponds to IL-1ra cDNA; the intrastromal injection group(group II) is to the right side of the marker, and the anterior chamber injection group(group III) is on the left; sample loading sequence in the two groups: from right to left: 3 days, before acute rejection, acute rejection, and two weeks after acute rejection.

