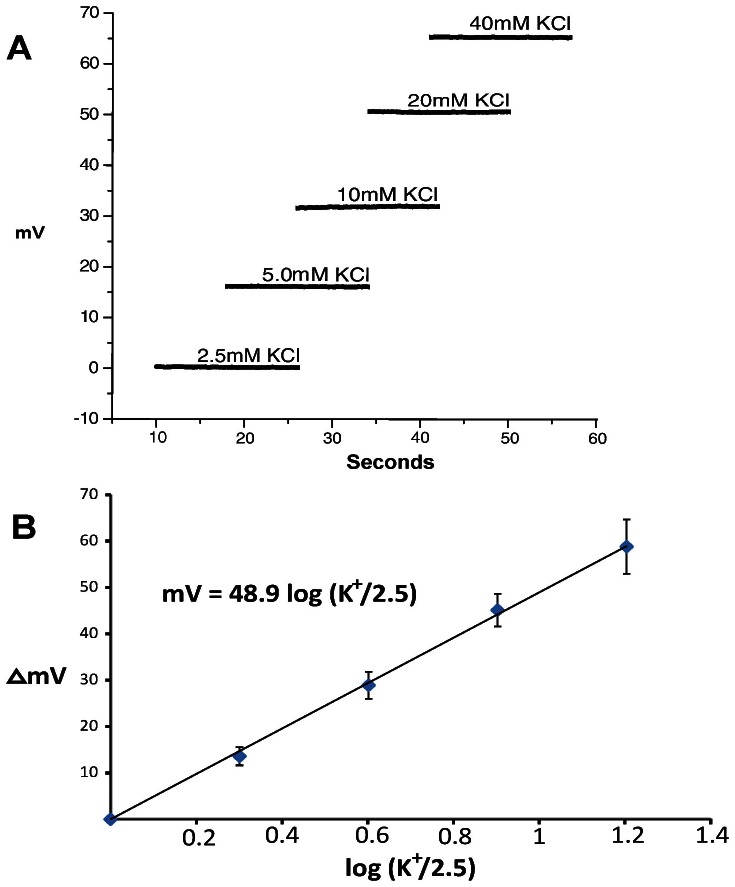
Figure 1. Determining the responses of K-sensitive electrodes.
A) Voltage responses of a K-sensitive electrode in test solutions containing differing concentrations of KCl at 24°C. B) Logarithmic plots of voltage response of K-sensitive electrodes with changing KCl. The slope for these K-sensitive electrodes was 48.9 mV/decade; Error bars represent standard deviations.

