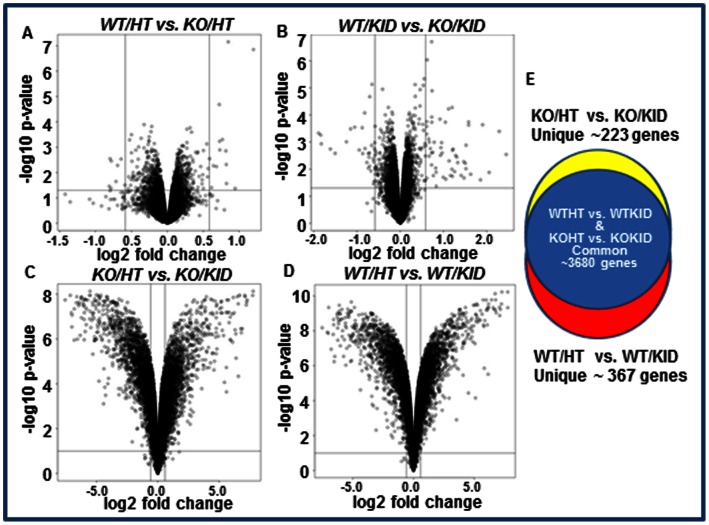
Figure 3. Effect of PAI-1 deficiency on differential global gene expression profiling in hearts and kidneys.
Differentially expressed genes are presented by volcano plots with fold induction or repression and statistical significance in four different groups. A. Expression levels of genes in wildtype and PAI-1 knockout hearts. B. Expression levels of genes in wildtype and PAI-1 knockout kidneys. C. Expression levels of genes in PAI-1 knockout hearts and kidneys. D. Expression levels of genes in wildtype hearts and kidneys. E. Venn diagram showing the differentially expressed genes which are common in PAI-1 KO/HT vs. PAI-1 KO/KID group and WT/HT vs. WT/KID group (Blue); and unique in PAI-1 KO/HT vs. KO/KID group (Yellow) and WT/HT vs. WT/KID group (Red).

