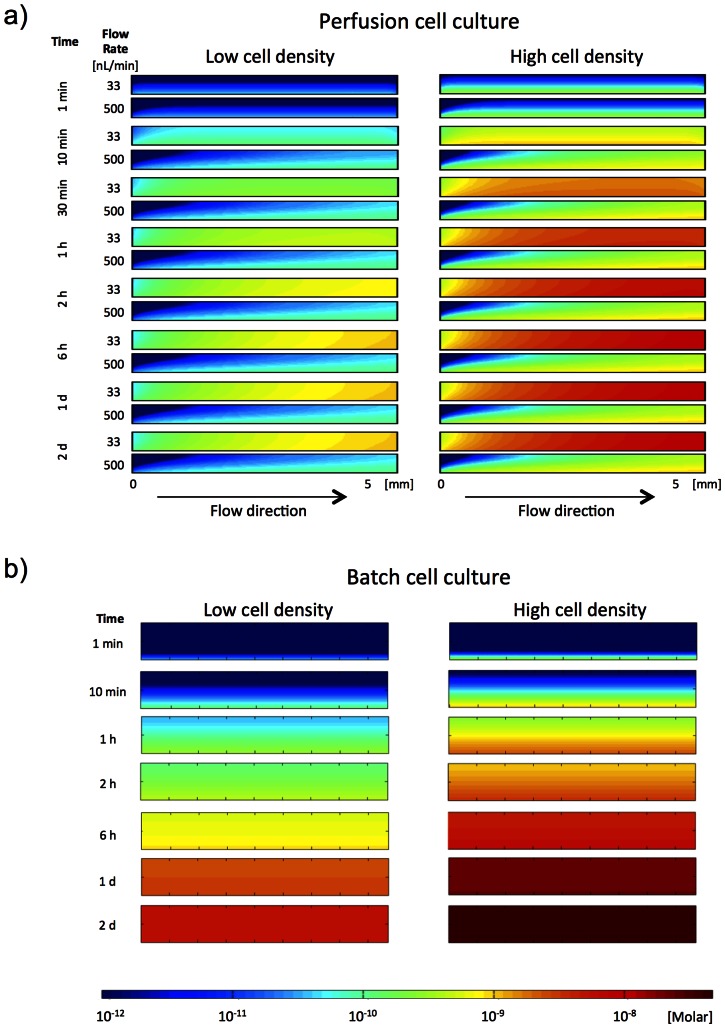
Figure 1. Numerical simulations of secreted factor accumulation in the chambers.
Simulated distribution of a cell-released factor from cells residing at the bottom of A) a microfluidic chamber (h = 0.5 mm, l = 6 mm, w = 1.5 mm) perfused at 33nL/min or at 500 nL/min, and B) a conventional well (d = 17 mm and a height of medium of 2 mm) at either low cell density (left) or high cell density (right). The high cell density condition corresponds to cells covering the entire surface, while the low cell density condition was set 8 times lower than the high cell density. The rate of secreted factor was set to 100 molecules per cell per second, which is one order of magnitude lower than estimated antibody production in hybridoma cells [48], [49]. Simulation of released factor is shown from 1 second to 2 days. See Materials and Methods for more details about the analysis.

