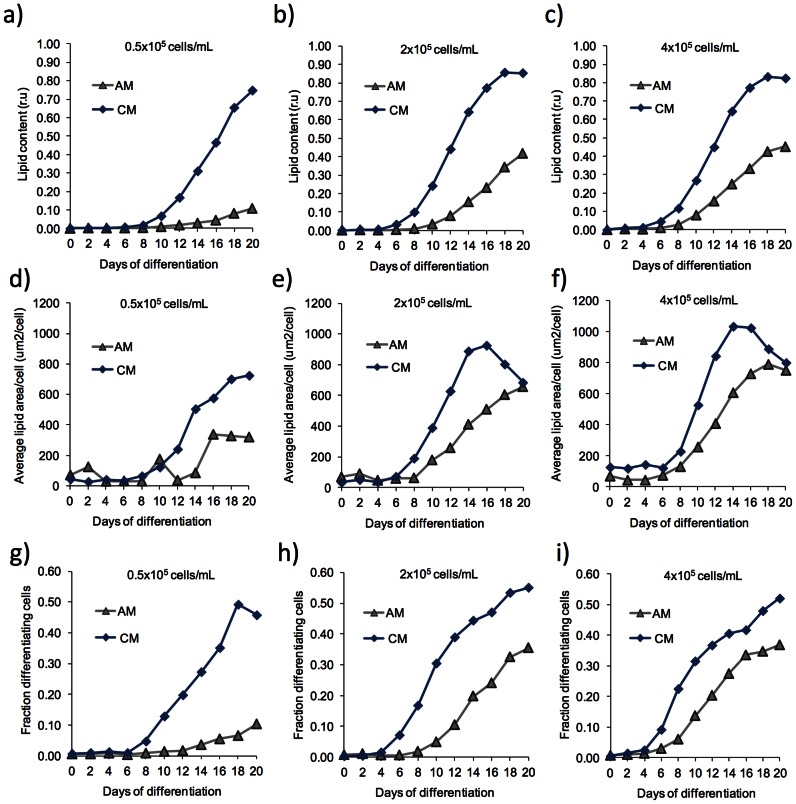
Figure 3. Time course study of lipid accumulation during adipogenic differentiation.
Experiment I out of two independent experiments was followed over time. An image of cells in the entire cell culture chamber was captured every second day and relative lipid accumulation in relative units (A–C), lipid area per cell (D–F) and fraction of differentiated cells (G–I) was determined as described in material and methods. Each graph in the diagrams corresponds to analysis of one chamber. Corresponding results from experiment II are shown in Figure S3.

