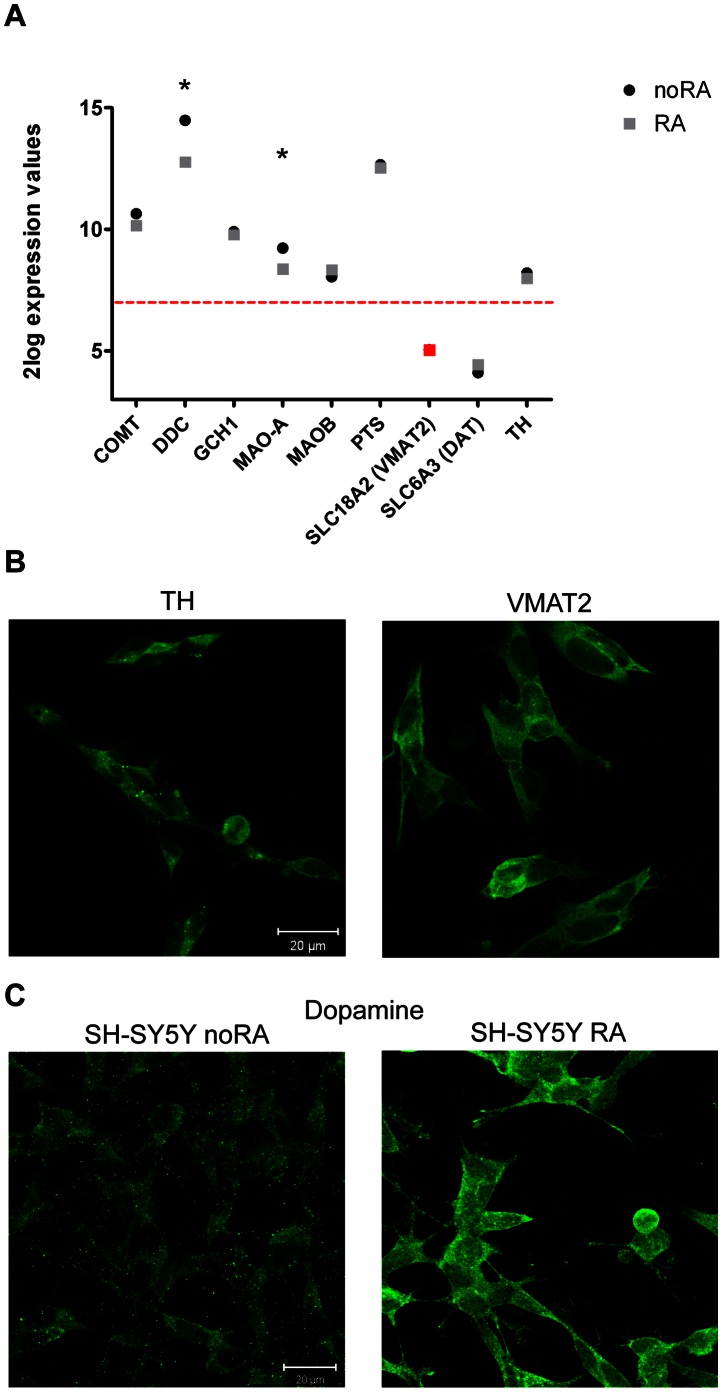
Figure 4. Expression of dopamine synthesis and turnover markers in noRA and RA differentiated SH-SY5Y cells at culture day 8.
Selection of genes is based on NCBI Gene data base and IPA. A. Microarray expression values of these molecular markers are presented for the noRA (black circle) and RA (gray square) treated cells at D8. Red line characterizes the cut-off at 2log intensity of 7 demarcating expression versus no expression of the mRNA in these cells (equivalent to 2×background levels). SLC18A2 (VMAT2) was not detected on the microarray, but confirmed to be expressed by qPCR analysis (red marking). Significantly regulated genes between the two conditions are marked with an ‘*’. B. Immunocytochemistry of two dopamine synthesis and transport proteins TH and VMAT2 expressed by the RA treated cells at D8. C. Immunocytochemical detection of DA in noRA and RA SH-SY5Y cells. Images, taken with the same laser intensity, consist of a z-stack projection of the cell layer.

