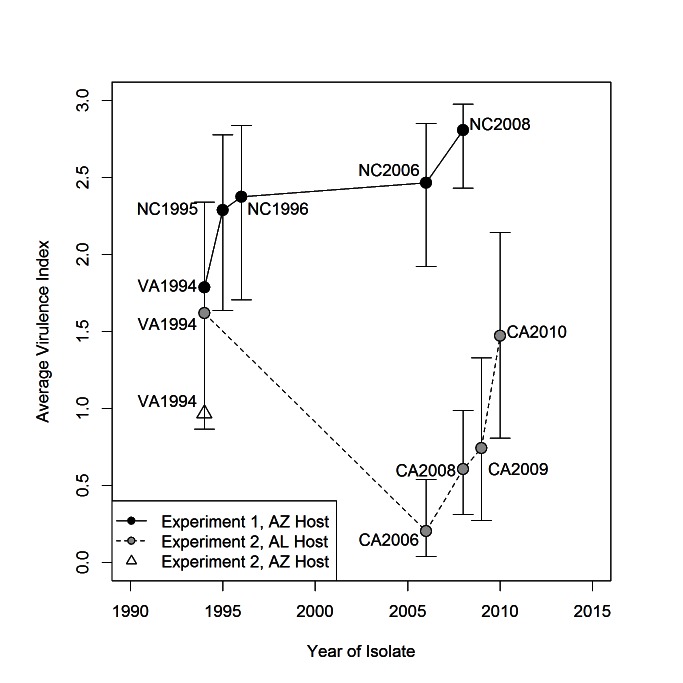
Figure 2. Average virulence index for each isolate of M. gallisepticum by year of isolation.
The average virulence index was calculated as the average response value over the eight sampled days PI (plotted separately in Figure 1). Each data point is labeled with the corresponding isolate (Table 1), and points connected by lines are from the same experiment and host population (AZ = Arizona, AL = Alabama). Bars represent 95% Bayesian credible intervals.

