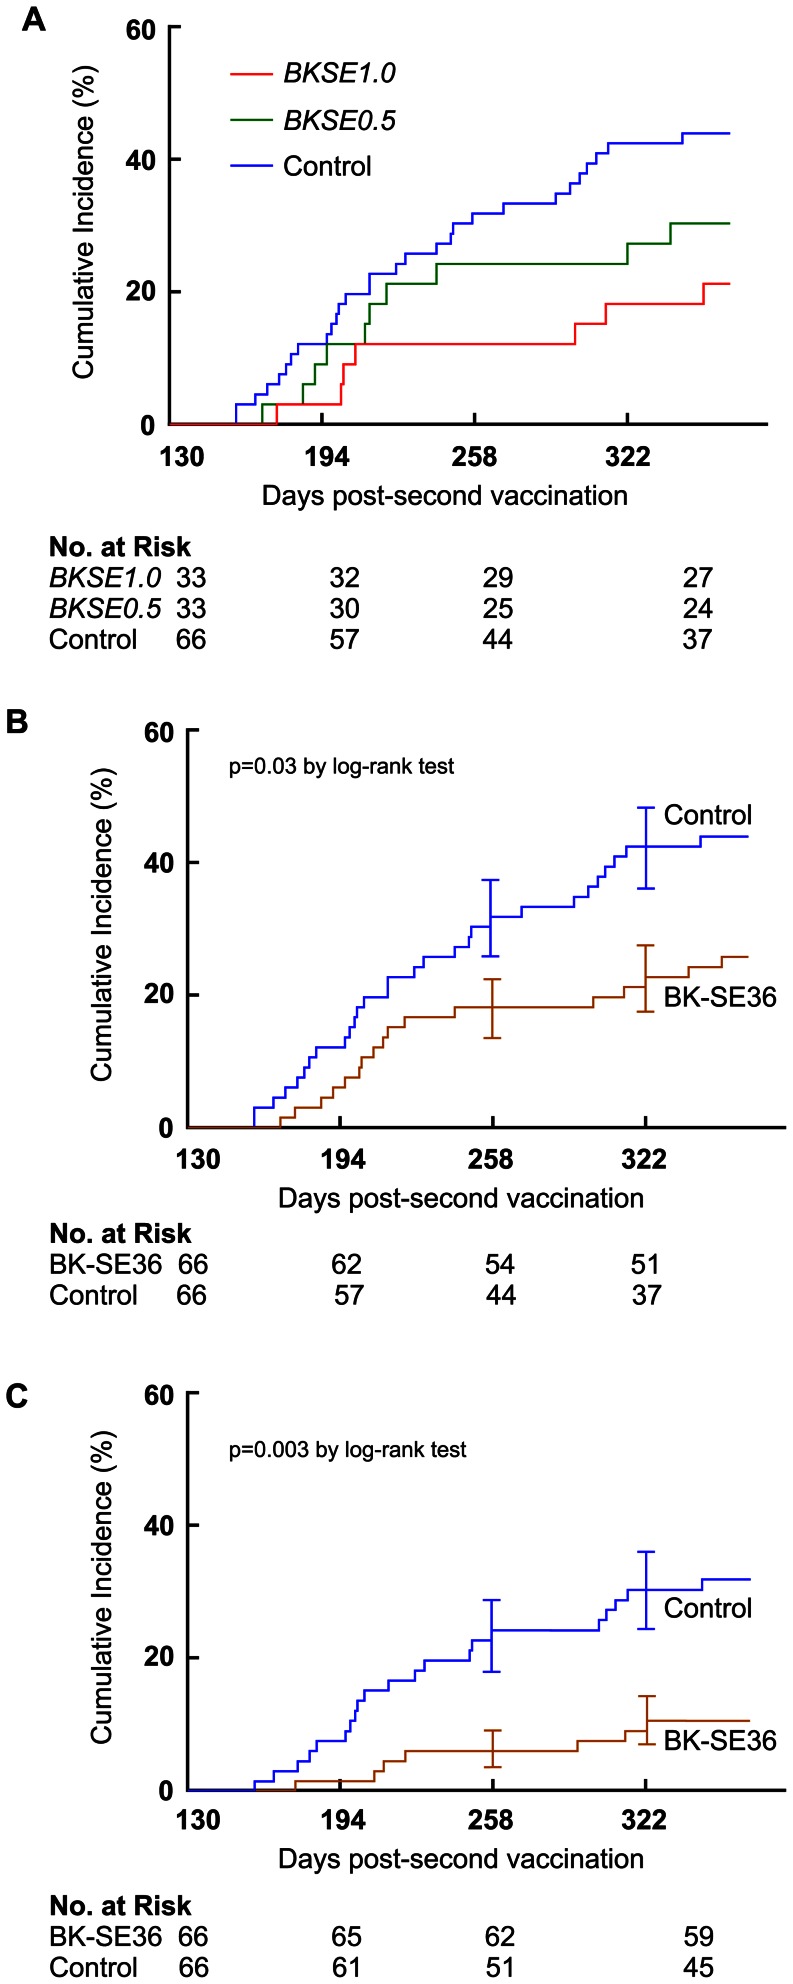
Figure 3. Kaplan-Meier curves of falciparum malaria episodes in 6 to 20-year old, 130–365 days post-second vaccination.
Incidence of first (or only) high parasitemia (≥5000 parasites/µL) episodes. The control group consisted of both placebo (vaccinated with saline) and subjects with no intervention. (A) According to vaccine group. Log rank test detected significant difference between control vs. BKSE1.0 (Chi square 4.92, p = 0.03) but not vs. BKSE0.5 (Chi square 1.59, p = 0.21). (B) Pooled analysis of all subjects vaccinated with BK-SE36 (BKSE1.0, BKSE0.5) compared to control with at least one episode of high parasitemia (Chi square 5.27, p = 0.02) or (C) high parasitemia+fever (axillary temperature ≥37.5°C) (Chi square 9.10, p = 0.003).

