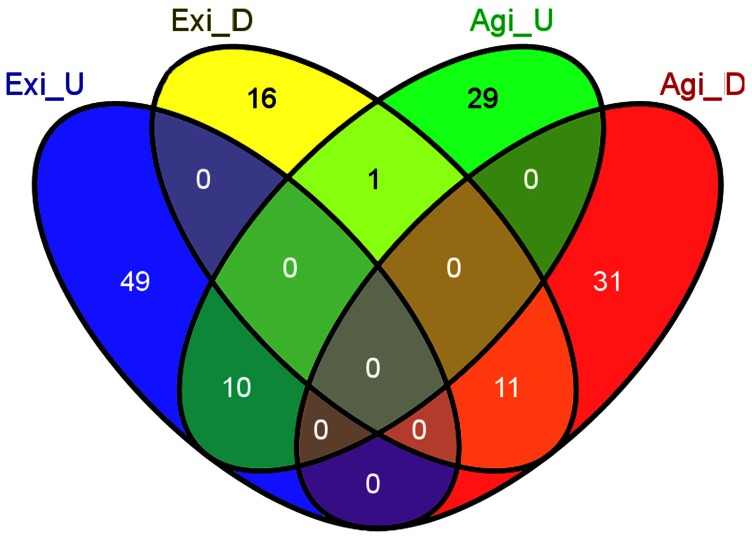
Figure 1. Venn diagram of miRNA analysis in EAC.
The Venn diagram was used to identify overlapping and non-overlapping miRNAs in the analysis of Exiqon and Agilent microarrays. 3 EAC tissue samples were used for microarray. 3 pooled NS tissue samples were used as a tissue comparator. miRNAs with ≥2 FC difference (up or down) were included. Exi, Exiqon; Agi, Agilent; D, down-regulated; U, up-regulated.

