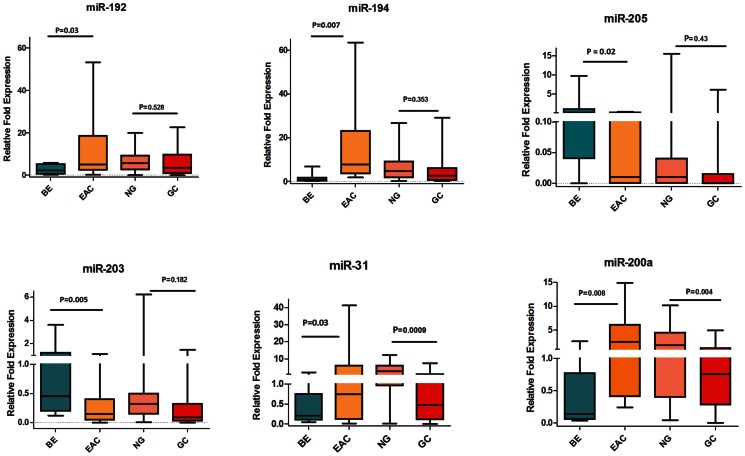
Figure 5. Identification of unique miRNAs for EAC.
The expression levels of the 6 miRNAs (miR-194, miR-192, miR-203, miR-205, miR-200a, and miR-31) were measured by means of qRT-PCR in 13 BE, 34 EAC, 45 NG, and 33 GC tissue samples. The FC of expression relative to miR-191 is shown using box-and-whisker plots. The plot groups the data into five categories: the lowest observation, the first quartile (Q1), the median (Q2), the third quartile (Q3), and the largest observation. The horizontal line represents the median value. Data were graphed as a range from 5th to 95th percentile. Student’s t-test was used for statistical analysis. A p value ≤0.05 was considered statistically significant.

