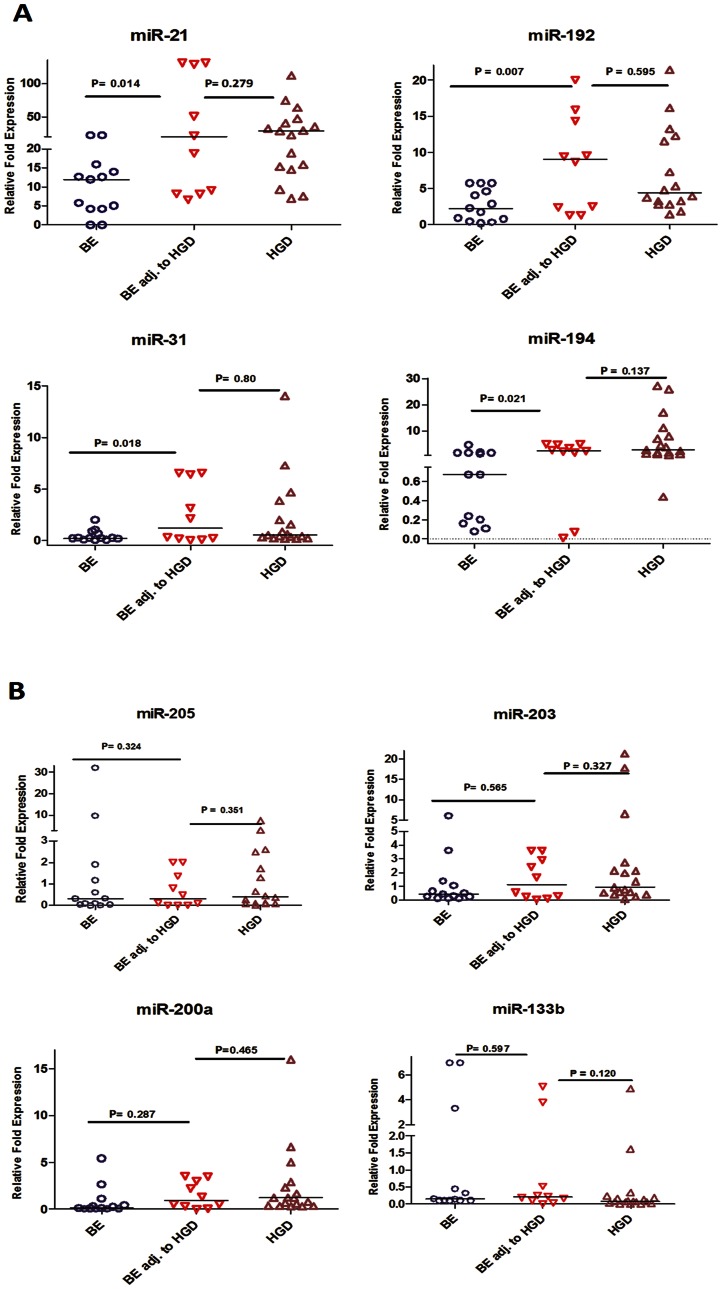
Figure 8. miRNA expression in isolated BE and BE lesions adjacent to HGD.
The expression of miRNAs in 13 isolated BE, 10 BE adjacent to HGD, and 17 HGD tissue samples were evaluated by qRT-PCR. The data are plotted as the FC of expression relative to miR-191 expression. Each data point represents a different patient tissue sample. The horizontal bars indicate the median. Student’s t-test was used for statistical analysis. A value of p≤0.05 was considered statistically significant.

