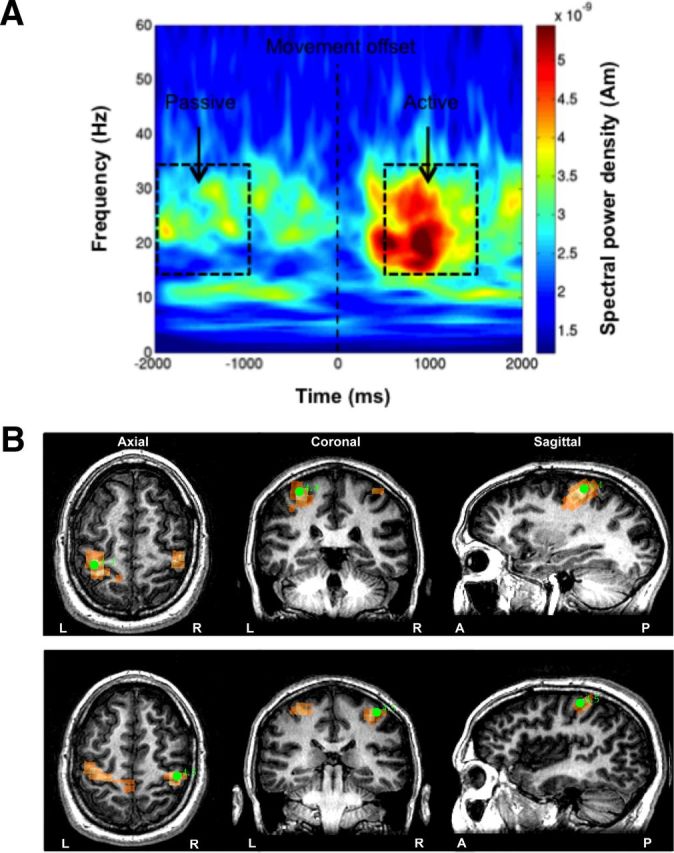
Figure 1.

Localization of motor cortex. A, Time-frequency plot of the source activity from a virtual sensor in a representative participant as derived from the SAM beamformer approach. The location was the largest PMBR activity in left M1 during abductions of the right index finger. Trials were aligned to the point of movement offset. The passive (−2.0 to −1.0 s) and active (0.5–1.5 s) time periods used to create the differential SAM images are indicated by black boxes. B, Functional identification of left M1 and right M1 from the PMBR following abductions of the contralateral index fingers. The 3D coordinates (green circles), which are superimposed upon the participant's MR image, represent the maximal t scores in left M1 (top, t = 4.4) and right M1 (bottom, t = 4.5), and indicate the neural generators of the PMBR.
