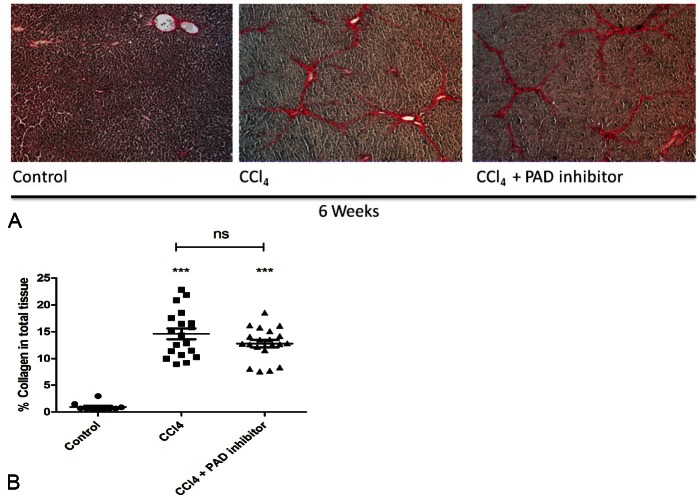
Figure 2.
Sirius red staining of liver tissue for all groups at 6 weeks. A. Total collagen levels as measured by quantitative histology on sirius red staining. B. The mean value for the control group was 0.9%, for the CCl4 group, 14.1% (P<0.001) and for the CCl4+PAD group, 12.7% (P<0.001). No statistically significant difference was observed between CCl4 and CCl4+PAD groups (P>0.05).

