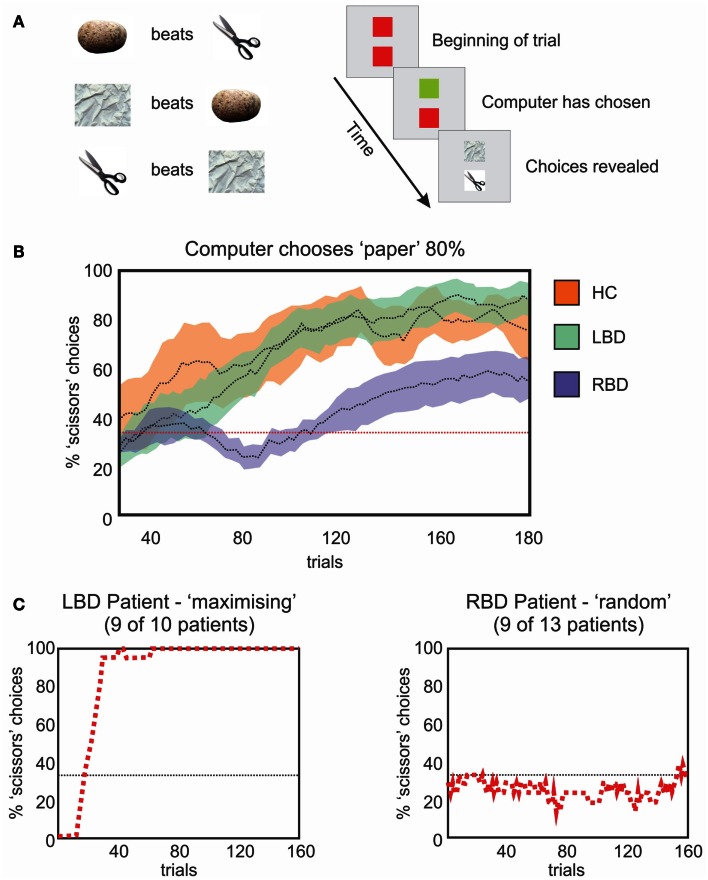
Figure 5.
(A) Schematic representation of the rules that govern the RPS task (left) and a single trial (right). The upper square represents the computer’s choice, the lower square the participant’s choice. The computer’s square changes to green when a choice is made and the participant then make a choice, after which, both plays are revealed to indicate the result. (B) Moving average (20 trials) of optimal choices vs. the strong bias of the computer (i.e., 80% paper). HCs (orange) and LBD patients (green) exploit the bias. RBD patients fail to exploit the bias as efficiently. (C) Representative performances from a LBD (left) and RBD (right) patient. The LBD patient maximizes choosing the optimal play 100% of the time. The RBD patient continues to play randomly and uniformly.

