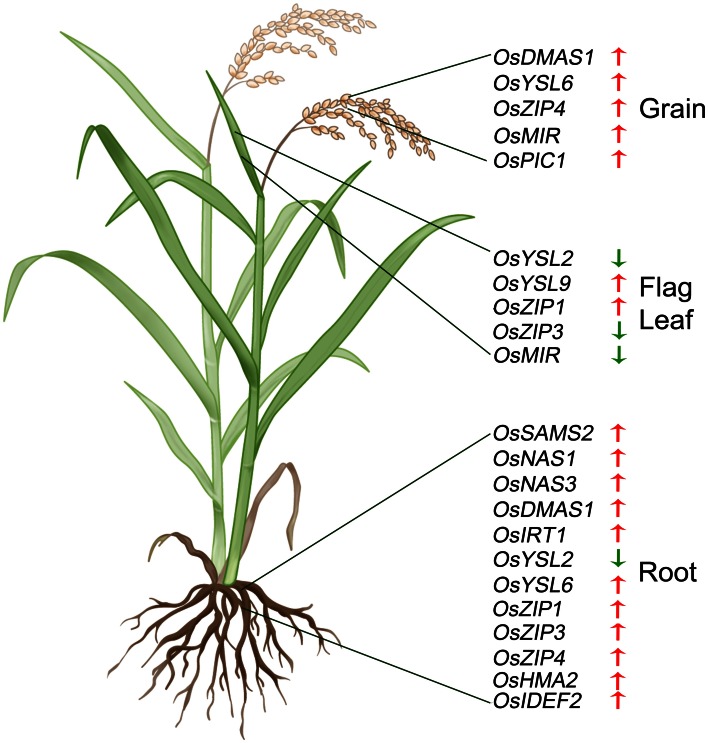
Figure 4.
Summary of significant expression changes observed in case of NFP plants vs. NTS plants, when subjected to low iron conditions. Upward red arrows indicate up-regulated expression while downward green arrows indicate down-regulation of a particular gene, in the NFP plants as compared to the NTS plants. The genes are specifically marked according to the parts (roots, leaves, or grains) where the expression difference was observed.

