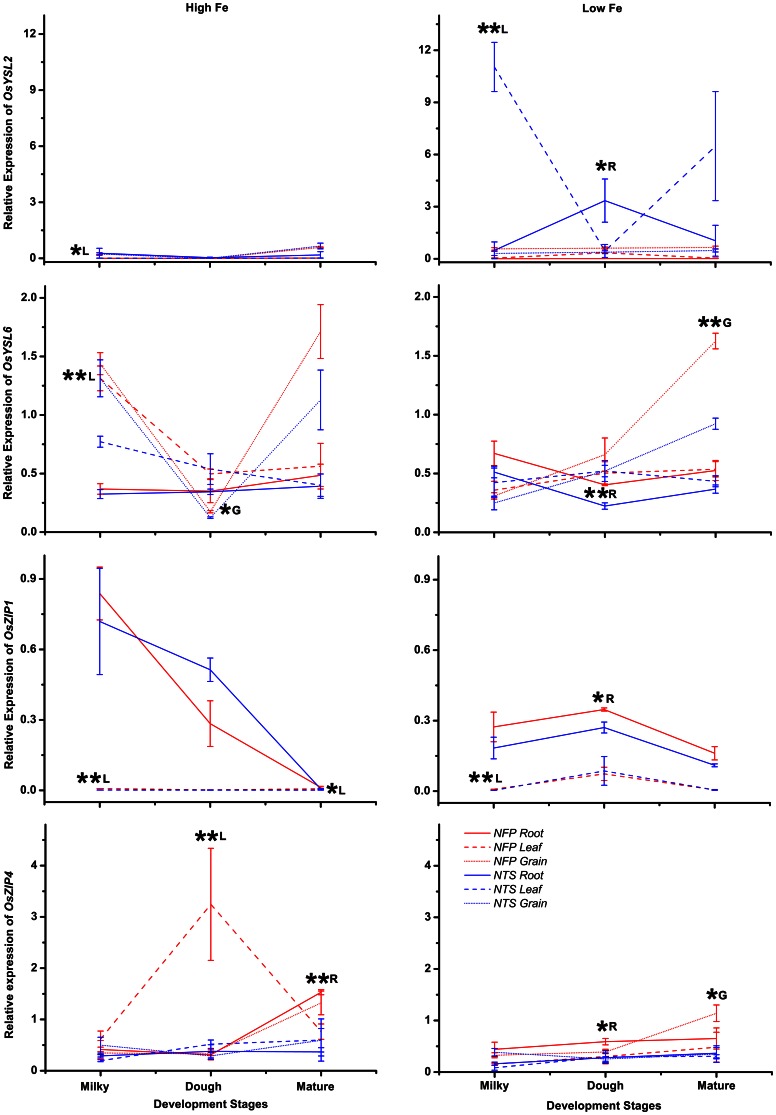
Figure A3.
Differences in expression levels of OsYSL2 and OsYSL6 (yellow stripe like transporters) as well as OsZIP and OsZIP4 (zinc- and iron-regulated transporters), in the roots, flag leaves, and grains of NFP vs. NTS plants are presented. Values are mean ± standard error of mean, of the three biological replicates. Significant differences between NFP and NTS tissues (roots, flag leaves, grains) under a particular treatment (high Fe or low Fe) or at a particular development stage (milky, dough, or mature) are marked with single (*p ≤ 0.05) or double asterisks (**p ≤ 0.01), respectively. The letters R, L, and G represent root, leaf, and grain, respectively. Note the differences in scale at Y-axis for relative expression levels of tested genes.

