
Table 2.
Summary of expression differences obtained between NFP and NTS rice plants.
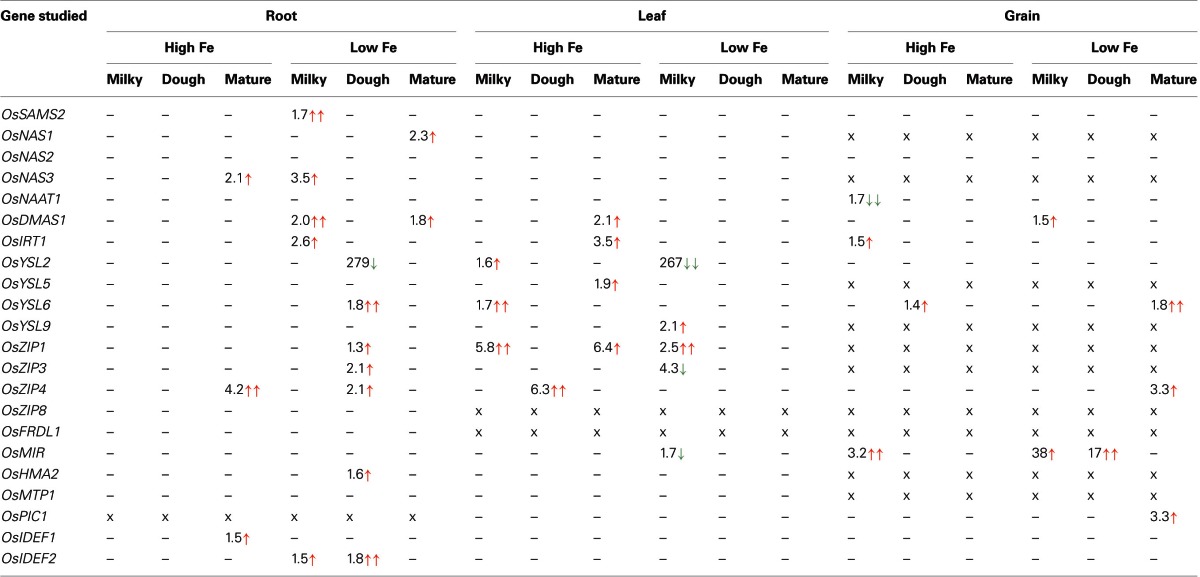
For a particular gene studied, “–” represents no significant difference among the two genotypes, “x” represent no test made, and the values on the table represent fold changes observed in NFP plants as compared to NTS (statistically significant changes), where red upward arrows depict up-regulation while the downward green arrows depict down-regulation in the NFP plants, for a particular gene. Double arrows indicate significance at p ≤ 0.01 and single arrows indicate significance at p ≤ 0.05. The milky, dough, and mature represent respective grain filling stages at which the plant material was collected.