Figure 3.

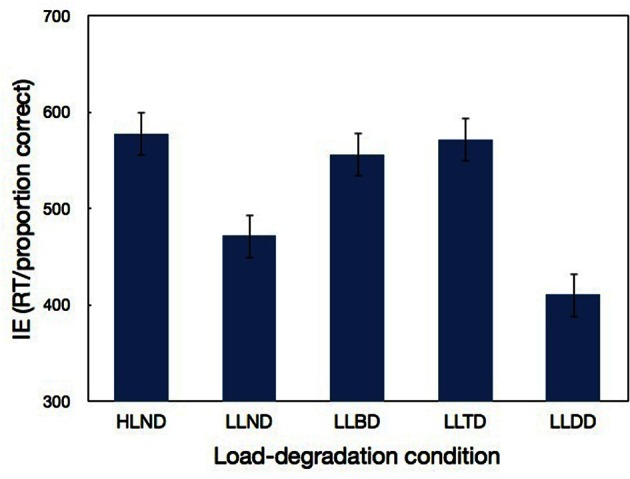
Participants' IE scores (inverse efficiency: RT/proportion correct) in Experiment 1 as a function of load-degradation condition. Error bars correspond to 1 SE.

Participants' IE scores (inverse efficiency: RT/proportion correct) in Experiment 1 as a function of load-degradation condition. Error bars correspond to 1 SE.