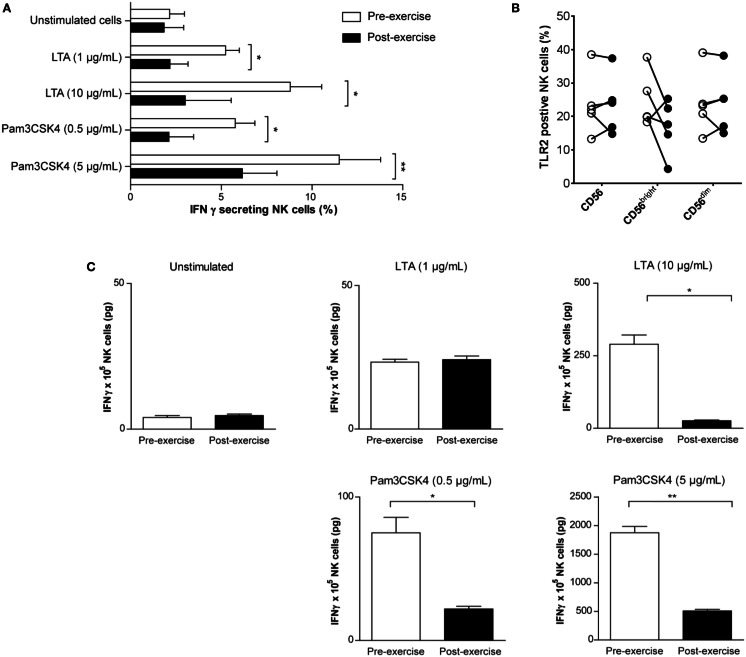
Figure 5.
TLR2 agonists do not fully induce IFNγ production by NK cells isolated following brief exercise. Pre-exercise (white) and post-exercise (black) isolated NK cells were treated with TLR2 agonists. (A) NK cells were either left untreated or stimulated with LTA (1 or 10 μg/mL) or Pam3CSK4 (0.5 or 5 μg/mL). After 24 h, the frequency of IFNγ producing NK cells was determined by flow cytometry using an IFNγ capture assay. Data represent the mean% ± SD of five different donors. (B) Surface expression of TLR2 on total CD56pos/CD3neg NK cells, CD56bright, and CD56dim subsets measured before and after exercise. Data were obtained analyzing PBMC by gating on living cells in a forward scatter/side scatter lymphocyte gate; followed by gating on CD56pos/CD3neg NK cells, CD56bright and CD56dim NK cells were identified based on CD56 and CD16 expression (see Figure S1 in Supplementary Material). Shown are the mean% ± SD of five different donors. (C), Total IFNγ (pg) produced by NK cell cultures (1 × 10⁵ cells/well) was measured by ELISA after 48 h TLR2 agonist treatment and compared to unstimulated cultures. Shown are the means (pg) ± SD of triplicates and the results are representative for one out of three donors. Significant differences are indicated in the graph as follows: *p < 0.05, **p < 0.01 (paired two tailed student’s t test).

