Figure 2.
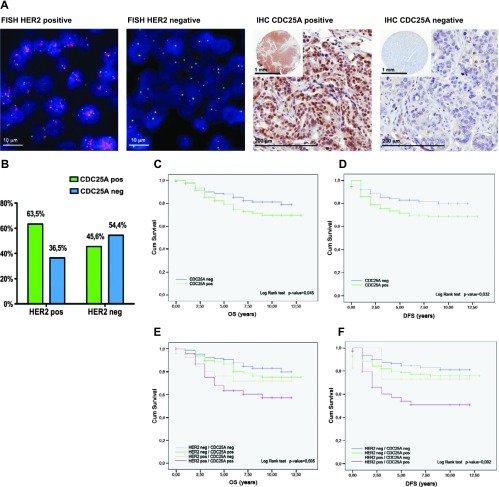
(A) HER2 status by FISH and CDC25A expression by IHC in human breast cancer. Representative example of HER2-amplified tumor (FISH HER2 positive): ratio Spectrum Orange-HER2 signals and Spectrum Green-centromere 17 signals > 2; the same case is an example of CDC25A-overexpressing tumor (IHC CDC25A positive): all infiltrating ductal carcinoma cells show strong staining with CDC25A antibody. Representative example of HER2-nonamplified tumor (FISH HER2 negative): ratio Spectrum Orange-HER2 signals and Spectrum Green-centromere 17 signals < 2; the same case is an example of CDC25A-nonexpressing tumor (IHC CDC25A negative): no expression of CDC25A is seen in the infiltrating ductal carcinoma cells. (B) HER2 gene status and CDC25A expression histogram; 63.5% of HER2-positive breast cancer patients showed CDC25A overexpression and 54.4% of patients with HER2-negative breast cancer were negative for CDC25A overexpression. (C and D) CDC25A expression significantly correlates with prognosis. Kaplan-Meier curves showed that overexpression of CDC25A was associated with the decrease of both OS (P = .045) and DFS (P = .032). (E and F) Significative stratification of mortality risk by combinations of HER2 status and CDC25A expression. The group of patients with the highest mortality was the one with HER2/CDC25A double-positive breast carcinomas in terms of either OS (P = .005) or DFS (P = .002; purple curves).

