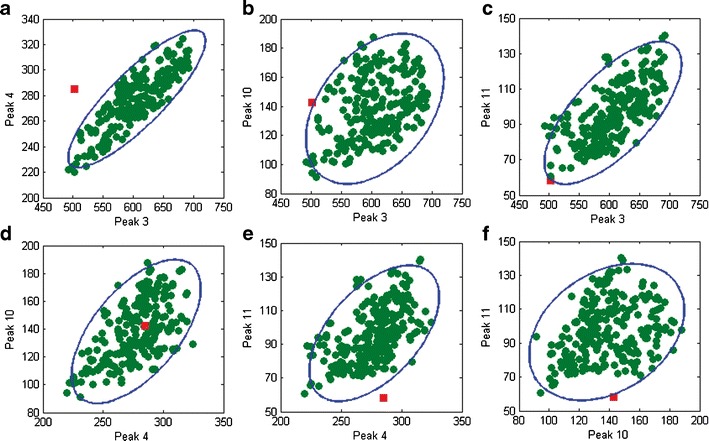
Fig. 7.

Bivariate plots of peak 3 versus peak 4 (a), peak 3 versus peak 10 (b), peak 3 versus peak 11 (c), peak 4 versus peak 10 (d), peak 4 versus peak 11 (e), and peak 10 versus peak 11 (f). The green dots and red boxes denote the 256 batches for modeling and batch 63, respectively. The blue ellipses denote the 95% confidence limits
