
Fig. 4.
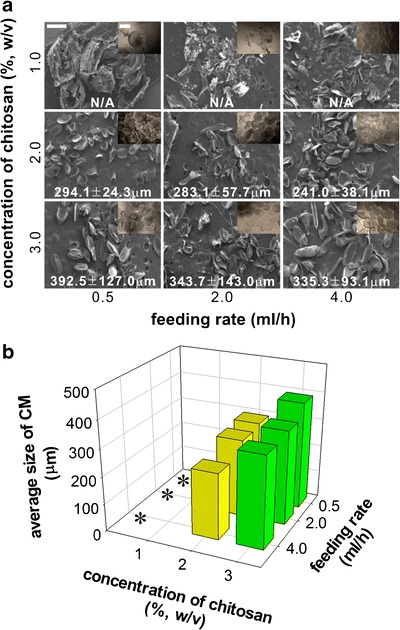
Fabrication of CMs with various feeding rates and concentrations of chitosan solutions at 10 kV. a SEM of the CMs after solidification in 4.0 M Na2CO3. The insets are the optical microscopic images of the solidified CMs before lyophilization. b Average diameters of CMs based on an image analysis of the SEM images. The average diameters were plotted against the concentrations of chitosan solution and feeding rates changes (n = 10). All scale bars in the images are 500 μm. Asterisks when chitosan concentration was 1% (w/v), the average sizes of CMs could not be measured because of irregular shapes of the CMs