Fig. 5.

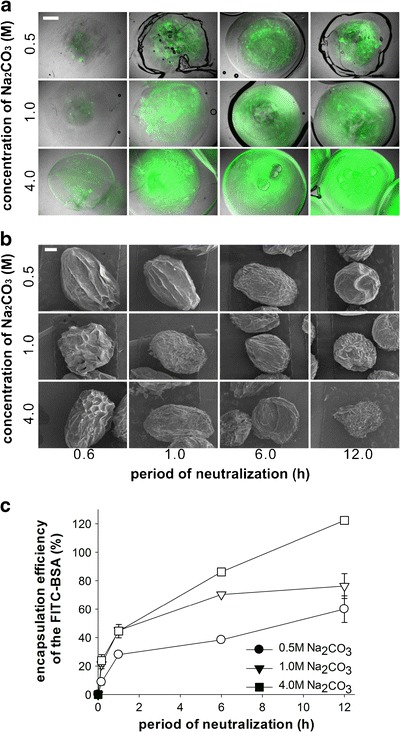
Encapsulation of FITC–BSA in CMs with various concentrations of Na2CO3 and neutralization periods. a Confocal laser scanning microscopy images of the FITC–BSA encapsulated CMs at 2.0 ml/h of feeding rate and 2.5 kV. The FITC–BSA was shown in green. b SEM of the FITC–BSA encapsulated CMs after lyophilization and c encapsulation efficiencies of the FITC–BSA in the CMs by measuring the fluorescence intensity of the supernatant after centrifugation of solidified CMs. All scale bars are 500 μm
