
Fig. 1.
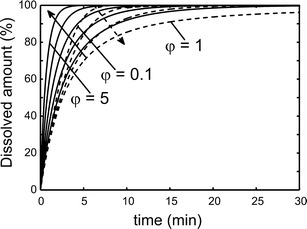
Simulated drug dissolution profiles for spherical nanoparticles with R 0 = 400 nm and ΔR = 0.15R 0. Values for φ were 0.1, 0.5, 0.8, and 1 (dashed lines) as well as 1.2, 1.5, 2, 3, and 5 (solid lines). The arrows indicate the direction of increasing φ. For φ > 1, dissolved amount (%) = C b/C s; for φ ≤ 1, dissolved amount (%) = C b/C tot