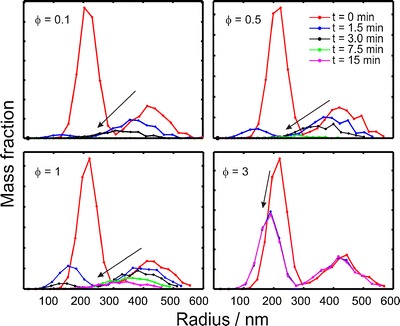
Fig. 3.

Mass weighted graphs of particle populations during the dissolution simulations. Parameters for the simulation were ΔR = 0.15R 0 and R 0 = 200 nm (95% of the population)/400 nm (5% of the population)

Mass weighted graphs of particle populations during the dissolution simulations. Parameters for the simulation were ΔR = 0.15R 0 and R 0 = 200 nm (95% of the population)/400 nm (5% of the population)