
Fig. 4.
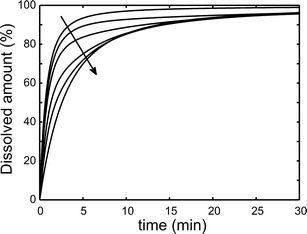
Simulated drug dissolution profiles for spherical nanoparticles with R 0 = 200 nm/400 nm and ΔR = 0.15R 0 when φ = 1. The number fraction of the larger particles was 0%, 2%, 5%, 15%, 30%, and 100%. The arrow indicates the direction of increasing fraction of large particles