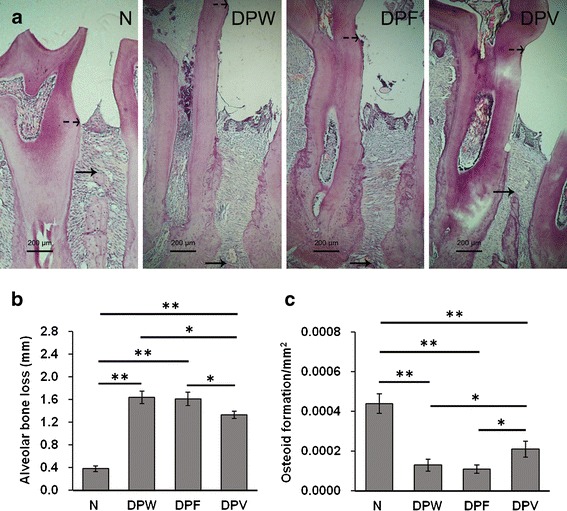
Fig. 6.

Mid-interproximal region between the first and second maxillary molars examined in each rat specimen. Bone loss was determined as the distance between the cemento-enamel junction (dotted arrow) and the highest peak of the interproximal bone (solid arrow) a. Alveolar bone loss b and the area of osteoid formation c were measured in H&E-stained sections. *P < 0.05; **P < 0.01. Data represent the mean ± SD (n = 10)
