
Figure 1.
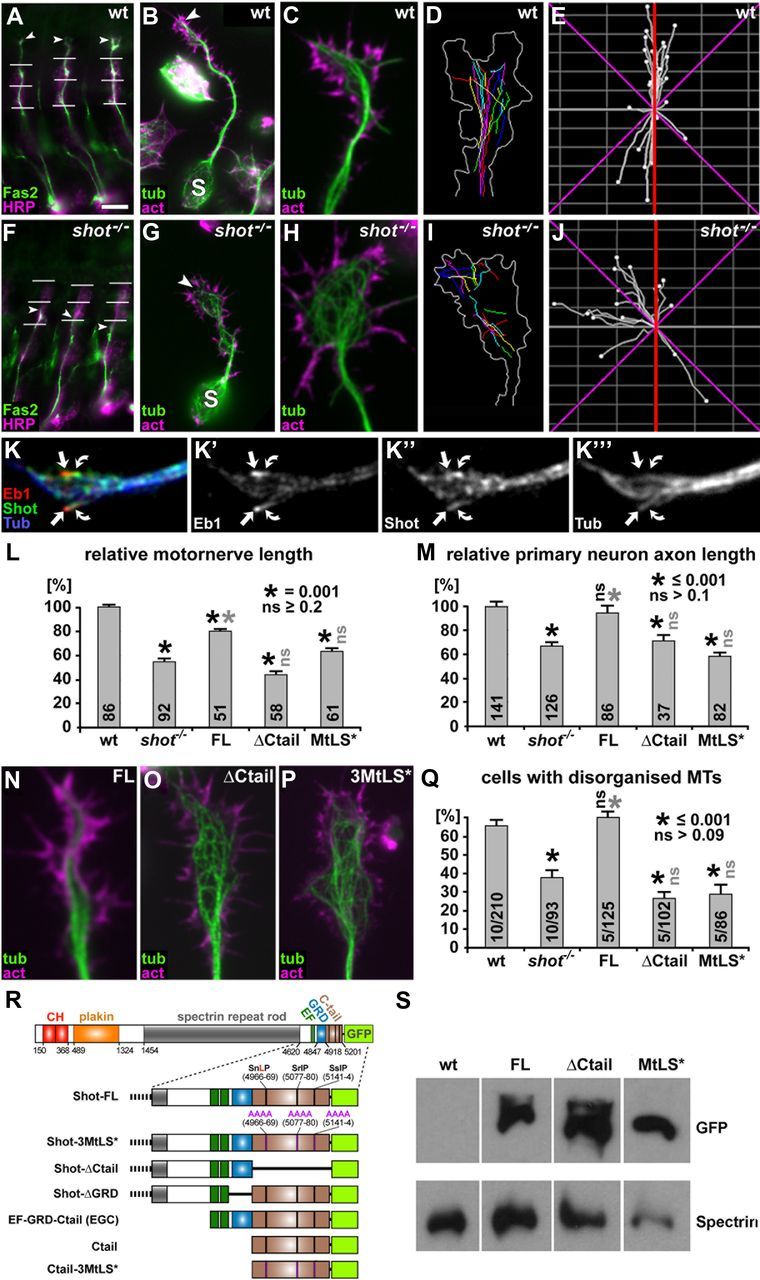
Ctail and MtLS motifs are required for axon growth and axonal MT organization in embryonic motor neurons in vivo and in primary embryonic neurons in culture. A–J, Illustrations of axonal phenotypes of wild-type (top) and shot−/− mutant neurons (bottom); stainings in A–C and F–H as indicated: act, phalloidin-labeled filamentous actin; Fas2, motor axonal marker Fasciclin 2; HRP, neuronal marker horseradish peroxidase; tub, tubulin. A and F show intersegmental motor nerves in three consecutive segments of the embryo which are shorter in the mutant (arrowheads, nerve tips; horizontal lines, indicators of ventrodorsal position as described in Materials and Methods); B and G show primary neurons after 6 h in culture with shorter axons in the mutant (S, somata; arrowheads, axon tips); C and H show close-ups of axonal growth cones of wt and shot−/− mutant primary neurons with disorganized MTs; D and I show traces of trajectories of polymerizing EB1-labeled MT plus ends (growth cone outline in white); E and J show directionality plots of the same growth cones with a higher degree of abaxial projections in the mutant (red lines indicate the axon axis, magenta lines represent 45° from the axon axis). K–K‴, Growth cones fixed with a specific protocol for MT plus end-associated proteins (Rogers et al., 2002) showing Shot at MT plus ends (green, curved arrows) trailing slightly behind EB1 (red, arrows) at the plus ends of MTs (blue). L, M, Quantifications of motor nerve lengths in embryos (see A, F) and axon lengths in primary neurons (see B, G) normalized to wild-type (wt); rescue experiments in shot−/− mutant embryos or neurons were performed with Shot-FL, Shot-ΔCtail and Shot-3MtLS*, as indicated; numbers in columns indicate the pooled numbers of assessed nerves or neurons; quantifications were statistically assessed by Kruskal–Wallis one-way ANOVA on Ranks (H = 181.593, 4 degrees of freedom, p ≤ 0.001 in L; H = 83.791, 4 degrees of freedom, p ≤ 0.001 in M) and Mann–Whitney rank sum test (black asterisks, significant when compared with wt; gray asterisks, significant when compared with shot−/−; black ns, not significant when compared with wt; gray ns, not significant when compared with shot−/−; values as indicated in insets). Note that rescues mediated by Shot-ΔCtail and Shot-3MtLS* show different trends in embryos and primary neurons, likely caused by distinct properties of these constructs in MT stabilization; Figure 2). N–P, Growth cones of 6 h shot−/− mutant primary neurons (compare H) expressing Shot-FL, Shot-ΔCtail or Shot-3MtLS*, as indicated. Q, Quantification of MT disorganization in 6 h primary neurons; numbers in columns indicate numbers of independent experiments (before slash) as well as overall numbers of assessed neurons (after slash); statistics as in L and M (Variance: H = 26.671, 4 degrees of freedom, p ≤ 0.001 in Q). R, Transgenic constructs of Shot-FL and its derivatives used for rescue experiments and localization studies (Figs. 1–4, 7; numbers refer to Ensembl ID FBpp0086744). S, Western blot analysis of embryos, wild-type or with sca-Gal4-mediated expression of Shot-FL, Shot-ΔCtail or Shot-3MtLS*, probed with anti-GFP and with anti-α-Spectrin as a loading control. Scale bars: (in A) A and F, 20 μm; (in B) B and G, 5 μm; C, D, H, I, N–P, 1 μm.